


The plunge in crude prices has every analyst struggling to call a bottom and every news outlet clanging swords against shields about the US Shale war with OPEC. Now a warm winter has sent natural gas prices plunging back to levels not experienced since 2001. All of this pain in the oil and gas patch is leading to dramatic cuts in investment. While oil markets watch for signs of OPEC cuts, we are watching for signals that the reductions in supply investment has set up a cyclical bounce in commodity prices.
Industry veterans, equity analysts, market consultants, and government agencies all agree that natural gas demand in North America is growing, driven by increasing demand from US industrial, power, and exports. However, the range of estimates for this growth over the next five years is broad, with some predicting demand growth as low as 10 Bcf/d and other predicting growth as high as 20 Bcf/d of incremental demand by 2020. To put this in perspective, from 2009-2014, average annual gas demand in the US has increased by 2.0 Bcf/d per year. Assuming that conservative rate of growth, by 2018 the US gas market should need to find an incremental 6.0 Bcf/d of natural gas supply while replacing declining gas production from existing wells.
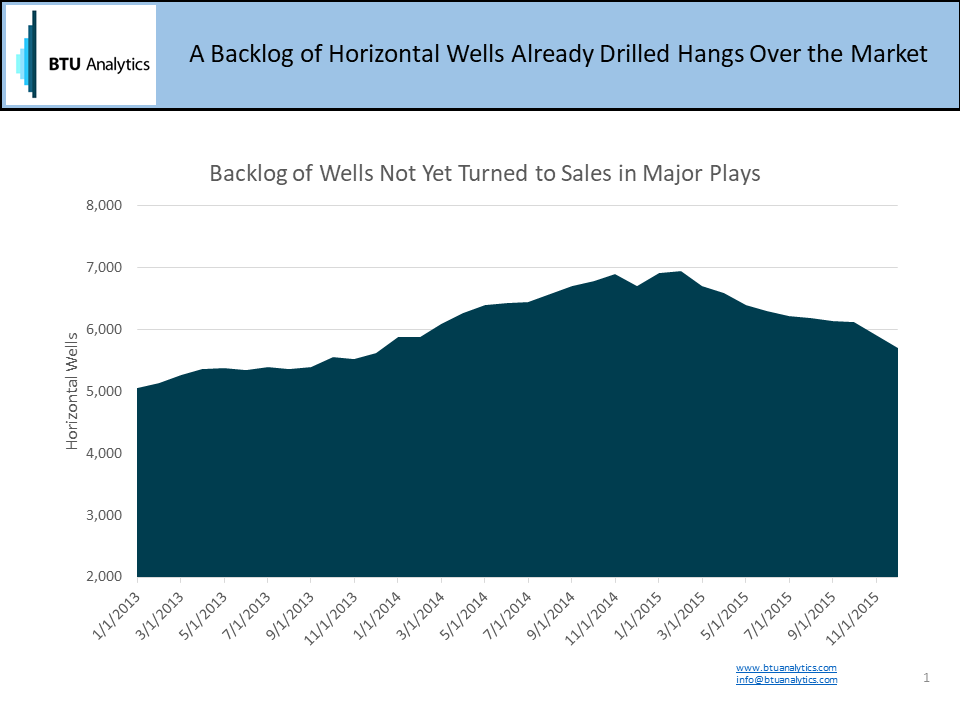
How do you find 6 Bcf/d of new gas supply when drilling activity has plummeted to just 700 rigs? First, you rely on the incredible backlog of wells that have been stockpiled across the Marcellus, Utica, Permian, Eagle Ford, and Bakken, where BTU Analytics estimates that almost 6,000 wells are in various states of backlog, including drilled but uncompleted wells (DUCs) and wells completed but not producing — completed on backlog( COBs – See Upstream Outlook for detailed analysis). But that stockpile could be consumed quickly if activity continues to decline from the current pace of drilling and remains at lower sustained levels. The rate of new horizontal wells being drilled has dropped from 1,800 at the end of 2014 to just under 800 for November 2015 with activity continuing to decline as capital budgets are set for further reductions in 2016 compared to 2015.
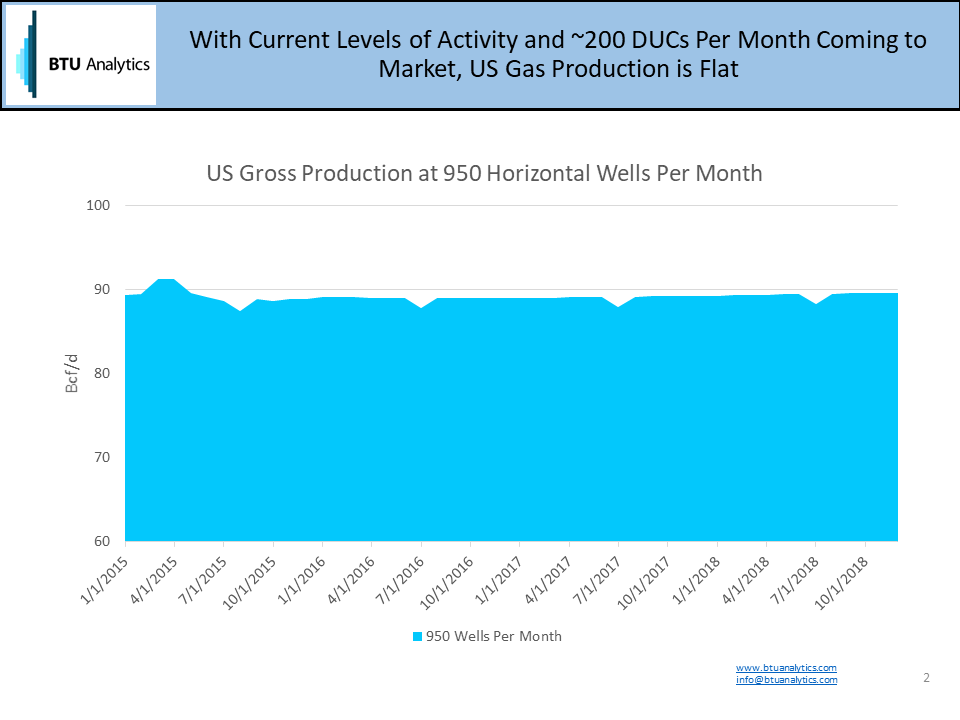
So let’s take a look at the implications to natural gas for 2018 if drilling activity in 2016 and 2017 stays at 750 new horizontal wells per month. Assuming we place an additional 200 wells to month to sales as a result of working down the inventory of drilled but uncompleted wells, we end up natural gas production flat to today’s levels.
But flat won’t cut it. The next question is where incremental supply will come from to meet the incremental 6 Bcf/d of demand. The Northeast has a substantial inventory of low cost gas supply but will have only approximately 6 Bcf/d of open takeaway pipe in 2018 according to models built by BTU Analytics. So the Northeast might be able to reasonably source supply at current levels of drilling activity assuming DUCs are worked through at a reasonable pace. That would seem to justify natural gas prices at Henry being based on a production cost plus transport, or certainly under $4/MMBtu.
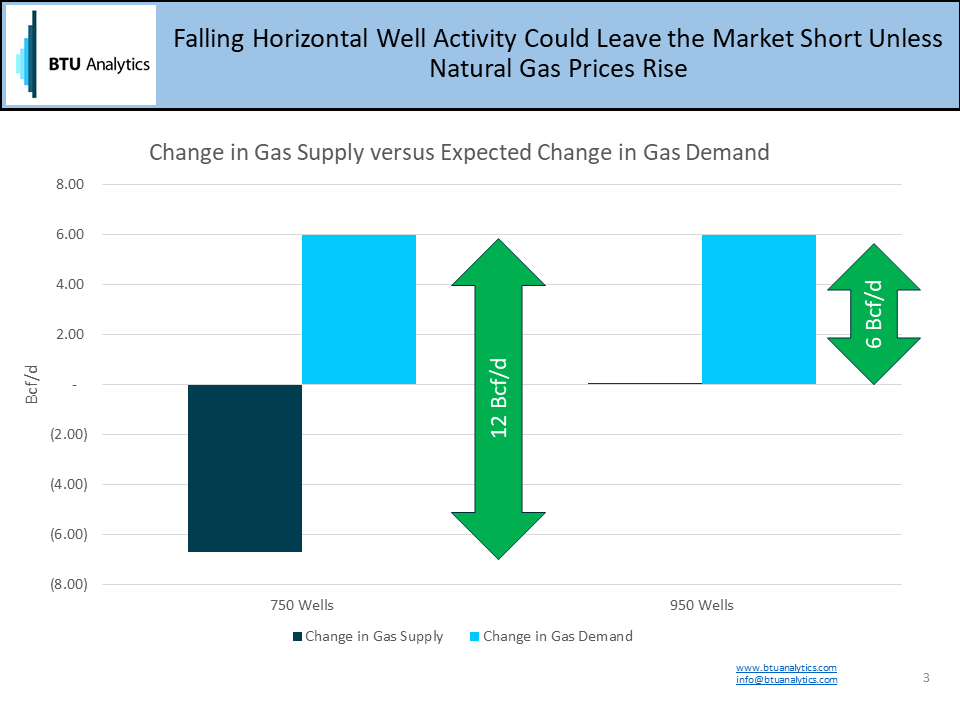
What if activity levels continue to drop? What if new drilling and DUCs only supply 750 wells per month to sales in total? The market could find itself 12 Bcf/d short, and with only 6 Bcf/d of available pipe out of the Northeast, additional gas supplies will be needed. To find 6 Bcf/d of gas outside of the Northeast the gas price will need to rise high enough not only to bring a few of the major dry gas plays back into the money, but to provide enough cash flow (or incentive to attract capital) to ensure the pace of drilling can keep up with the market’s needs. Is $6/MMBtu Henry Hub out of the question? Maybe not.
To keep up with BTU Analytics’ latest thoughts on production, natural gas prices, infrastructure and markets, register now for BTU Analytics’ upcoming Houston conference What Lies Ahead or visit our Products pages.


