


The SCOOP and STACK plays in Oklahoma saw a significant amount of attention from producers in late 2015. Devon recently acquired Felix Energy and 80,000 additional acres in an over-pressured part of the STACK for $1.9 Billion. Continental has been expanding and de-risking their acreage as they shift more focus toward Oklahoma in 2016. Newfield has seen steady improvement in their STACK well results and have reduced drilling times for their 10,000 ft laterals by ~30% over their 2014 averages. All of these producers have highlighted their great initial results and high IP rates, indicating that the development of these liquid rich and over-pressured Oklahoma horizons could play a significant role in US natural gas and crude supply in the upcoming years.
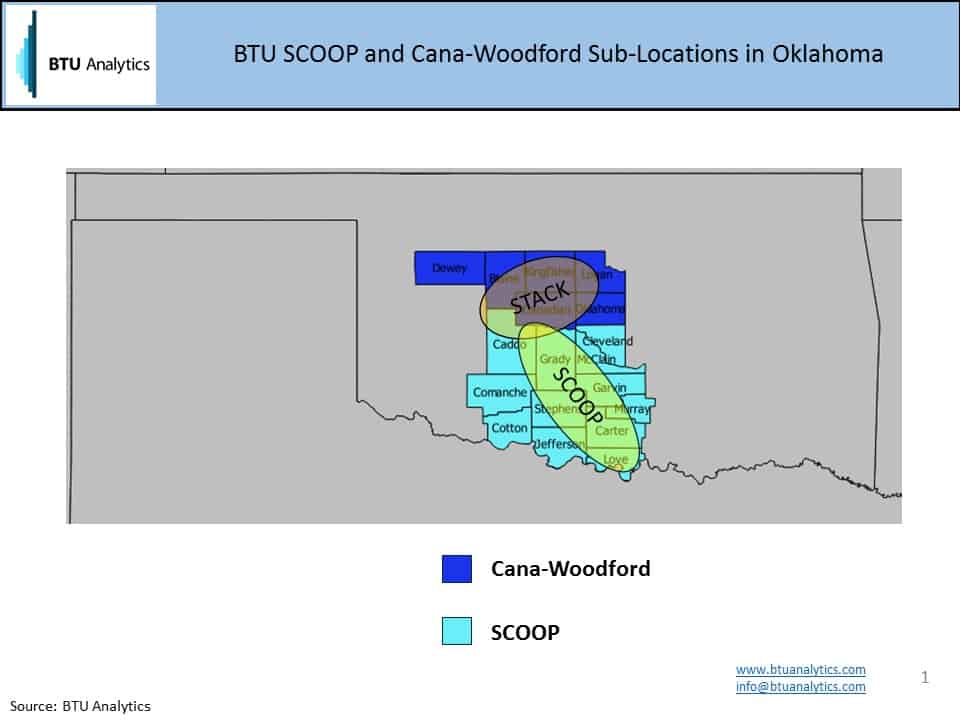
Due to the recent interest in the SCOOP and STACK, BTU Analytics decided to take a look into publicly reported data and try to validate the reported potential of the play. What we found left much to be desired. The production data available from Oklahoma isn’t particularly useful because of the way data is reported to state entities.
While gas data is reported at the well level, oil data is only reported at the lease level. Some reported production from leases lacks API numbers, complicating the process of allocating lease level production to individual wells. This is apparent when a significant percentage of the data (~10% for 2015 SCOOP and STACK regions) report wells with large oil volumes and zero gas volumes, or vice versa. This leads to artificially low averages when not carefully analyzed. Keeping this in mind, let’s take a closer look at that data that is available.
The type curves by producer shown above for 2013-2015 don’t show too much out of the ordinary. Newfield Exploration comes out on top, but the results aren’t anything that would lead us to expect that the SCOOP and STACK are the next big area for oil production. So instead, let’s look closer at the individual well data.
Above is a breakout of the 30-day average oil IP rates for individual wells. We can see that there is a strong presence of outliers in 2015, showing multiple wells with very strong IP rates. Newfield in particular has been highlighted because of their many wells in the 800 b/d range and a couple of wells above 1,000 b/d. Although the data is only currently available through July of 2015, we may see a continuing trend towards high producing wells as the data fills in through the second half of 2015.
The story on the gas side is very similar. Here, Continental is singled out due to their very prolific well results in the first half of 2015. Not only are we seeing multiple gas IP rates above 10,000 Mcf/d, but we can also clearly see how Continental was ramping up their drilling within the region.
This data gives us a small insight into activities within the SCOOP and STACK regions, but lack of recent data limits the confirmation of the most recent well developments. Look to BTU Analytics’ Upstream Outlook for the most up to date information on the SCOOP and STACK production numbers and infrastructure development.


