Similar to the Northeast, pipeline infrastructure projects to connect growing Canadian oil production to global demand markets often face significant regulatory and environmental opposition. On May 29, 2018, Kinder Morgan announced that the Government of Canada had agreed to purchase the Trans Mountain after Kinder Morgan considered canceling the project. Since then, news has turned considerably more positive on the Canadian pipeline front. Construction is expected to resume on Trans Mountain’s 590 Mb/d expansion and Enbridge received approval for its Line 3 Replacement project from the Minnesota Public Utilities Commission after several delays. This project will be a full replacement of Enbridge’s Line 3 pipeline which connects Hardisty, AB to Superior, WI, and will increase the route, back to its full capacity of 760 Mb/d.
However, between today and when Enbridge Line 3 goes into service in 2H 2019, Canadian crude logistics will continue to face an uphill battle. Existing pipelines serving Canada have been running at max utilization for several years now, leading to weak WCS differentials which then, in turn, support crude by rail movements. Below is a chart showing the nameplate capacity and flows of three key pipeline systems serving Canada: Enbridge Mainline, Keystone, and Trans Mountain Pipeline.
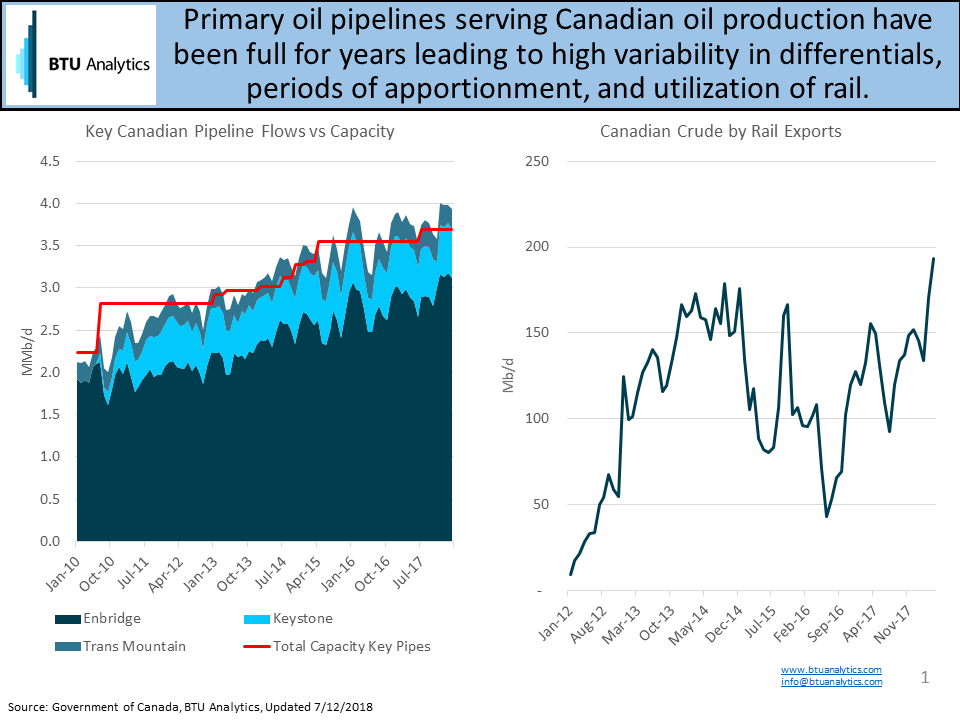
In 2018, as production has continued to grow, so have crude by rail volumes. In April, rail exports reached a new peak of 193 Mb/d and will need to continue to grow as producers bring new production online throughout the year. BTU Analytics estimates 340 Mb/d of average growth for Canadian production in 2018 relative to 2017 and this incremental production will largely be required to move via rail.
Even though rail can continue to provide an outlet for stranded Canadian barrels, labor, rail cars, and loading facilities remain variables that could impact how much Canadian crude can truly move over rail. In 2017, average rail volumes were 131 Mb/d. BTU Analytics estimates that volumes will average 244 Mb/d in 2018 and continue to increase into 2019 until new projects are completed.
The chart below shows BTU Analytics’ current outlook for Canadian production relative to local refining demand and takeaway and highlights the imminent need for additional rail or pipelines to support Canadian production growth.
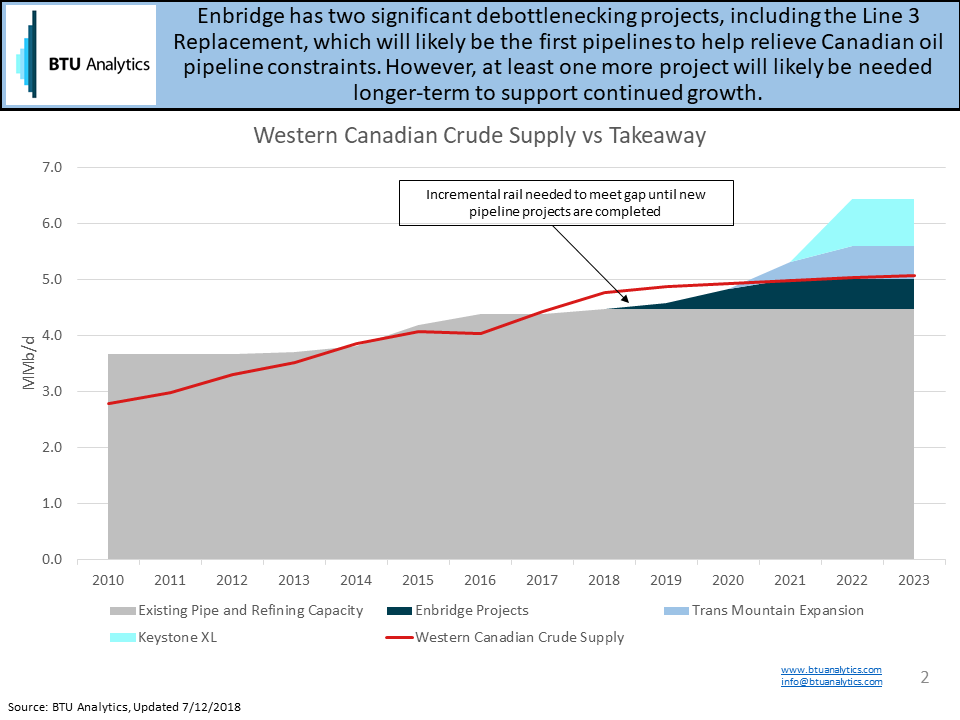
Finally, in addition to Enbridge’s Line 3 Replacement project and other smaller debottlenecking projects, Canadian supply growth is likely to support at least one more pipeline in the next five years. At this juncture, Trans Mountain seems to have gained momentum and is expected to resume construction shortly, targeting a December 2019 in-service date. Should both of these projects be completed on time, Canadian producers may finally see relief of differentials and have room to increase production beyond current plans.
For more information on BTU Analytics’ outlook on Canadian production, request a free sample of our Upstream Outlook Report.