Over the summer prices have stabilized around $40/bbl. While some producers claim that they can make $40/bbl WTI work, almost everyone can agree that higher prices are necessary for the US shale industry to survive and thrive. But what price is necessary? The answer to that question depends on a number of factors, and many of them are difficult to quantify. However, one factor that can be quantified is the potential impact of natural gas pricing. Today’s commentary will use our BTU View platform to quantify the impact of gas pricing on inventory in crude focused shale plays.
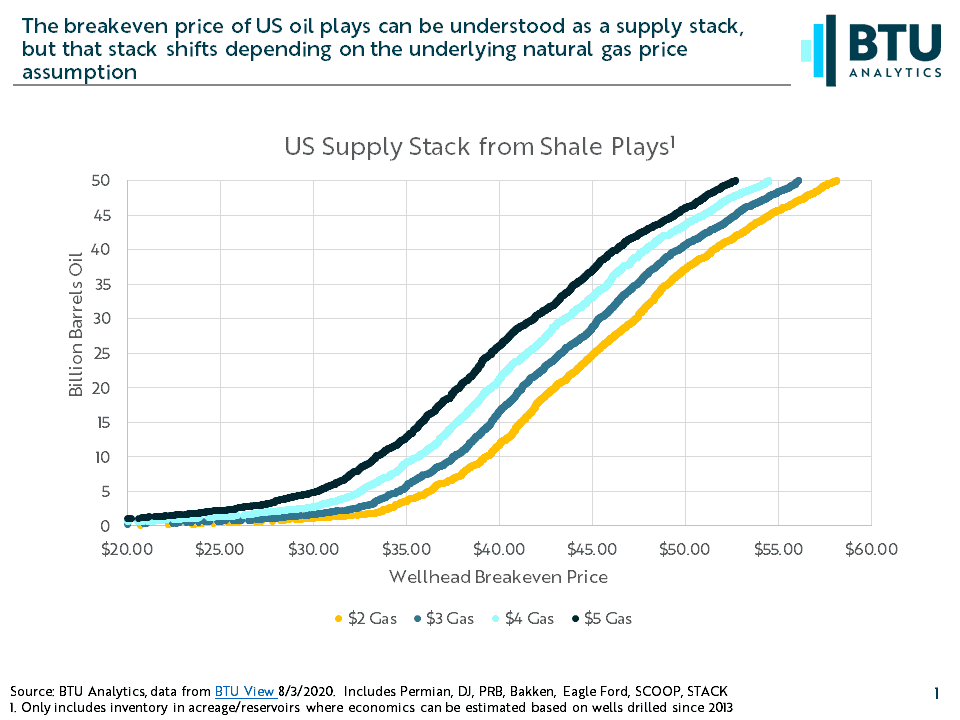
With US shale development now into its second decade, the location of most US resource is well understood. The economics of producing that resource is too often reduced to a single number, because single numbers are easier to understand, and we are as guilty as anyone of making statements such as “US shale works at $60/bbl”. However, the economics of oil plays can move meaningfully when natural gas prices change. For this reason, all of the well level economics and inventory analysis by breakeven BTU Analytics provides in the BTU View can be viewed at current strip pricing as well as a number of other price strips.
The chart below is pulled directly from the BTU View Economics interface. Each data point represents a single nine square mile area or “grid” where horizontal development has occurred within one of the major shale basins. Within each grid, BTU Analytics has determined the number remaining locations by reservoir and assigned a breakeven to that grid based on average well performance and current estimated well costs. The x-axis shows the wellhead breakeven price for remaining locations across the US shale basins. The y-axis aggregates the cumulative amount of oil resource associated with all locations that breakeven at that price and below. An example of one observation that might be made from this chart is that assuming wellhead prices of $2.00 natural gas and $45.00 crude oil, 25 billion barrels of oil resource could be economically developed using a discount rate of 10%.
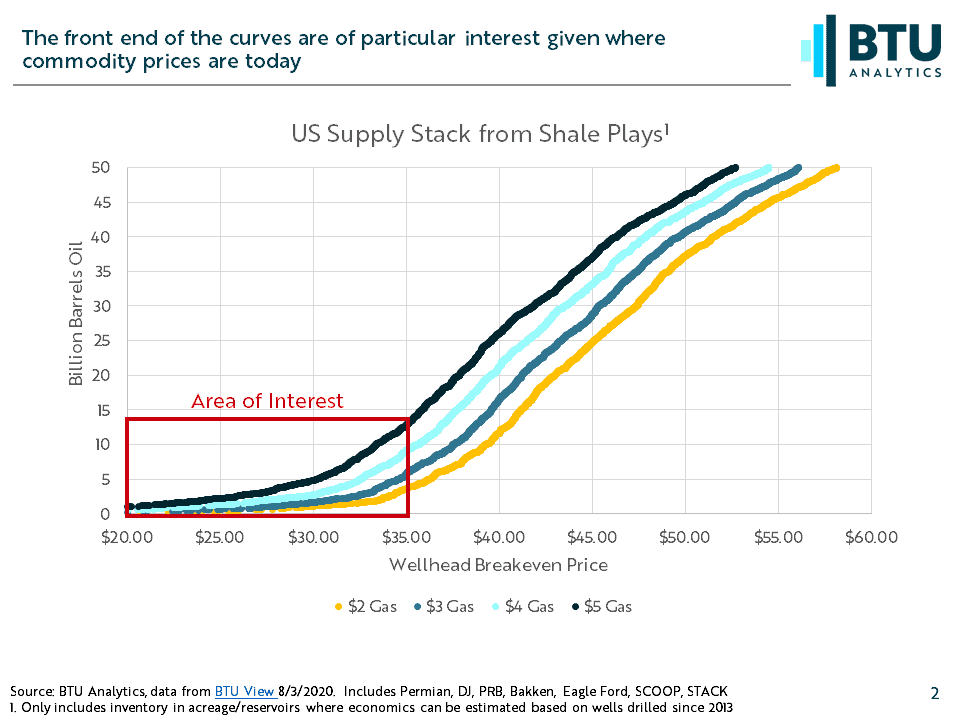
While there are several interesting observations that can be drawn from this chart, today’s commentary is focused on what can work at $40/bbl. To understand that answer, we will zoom in to the front of this chart, focusing on the curves from $20 – $35/bbl. Note that using $35/bbl on the high end allows for the differences one might expect to see between WTI benchmark pricing that is often referenced and the price a producer might receive in the field.
When zoomed in we can see the granular detail of individual data points. At $2/mcf natural gas prices very few grids breakeven below $30/bbl. More data points appear between $30/bbl and $35/bbl, where the disparate data points begin connect into what looks like a line. The small number of data points is notable because some producers are claiming that they have acreage that works at $40/bbl. This analysis would indicate that the runway of drillable locations that are economic at $40/bbl WTI is very limited.
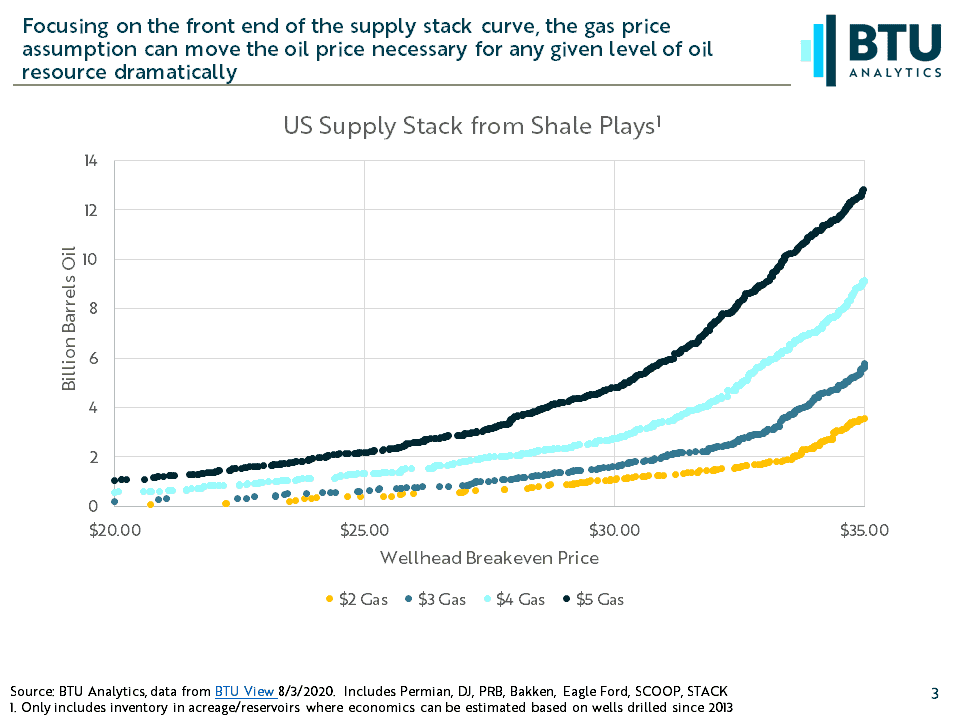
However, higher natural gas prices can double or triple that runway. At $35/$2 our analysis estimates 3.1 billion barrels of oil resource is available, while at $35/$4 that resource climbs to 9.1 billion barrels of oil. Looked at another way, a two dollar move in natural gas prices can shift the oil supply stack $3-10/bbl depending on the spot in the curve, with more impact being felt at lower oil prices. From this data it is readily apparent that you can’t understand the economics of US oil plays in a $40/bbl environment without having some knowledge of natural gas pricing fundamentals.
This analysis highlights the power of underlying assumptions in shale market analysis. Want to see more? Request a trial of our BTU View Economics or Production platforms, and use the data BTU analysts use to understand oil, natural gas and power markets.