A couple days ago the Forbes shale gas piece circulated around our shop. We are always interested in contrarian ideas backed by analysis, especially as it relates to energy markets, but this widely circulated piece turned a blind eye to some basic economics and producer behavior.
Are producers throwing larger and larger sums of money to drill shale wells that rapidly decline? Yes they are. Have many Super Majors written off shale assets and slowed E&P spending growth in recent years? Yes they have.
At the end of the first paragraph the author states: “America’s shale gas resources and reserves have been grossly exaggerated and today’s level of shale gas production is unsustainable. In fact, due the distortions of zero interest rates and other factors, an enormous shale gas bubble has developed. Like all bubbles, this one will pop sooner than expected and when it does, the aftermath will be very unpleasant.”
We make our living in the energy industry so if something “unpleasant” is about to happen, we want to know. We kept reading.
The author goes on to say: “However, the shale gas boom is rapidly maturing and we are quickly approaching a point where shale gas production heads into decline. In fact, the majority of shale gas basins in America are already exhibiting declining production.”
Ok this is a big statement and at this point we are looking for some data on producer internal rates of return by play at various gas price levels and associated rig activity by play to back this point.
The author goes on – “Production from the Haynesville shale of Louisiana, which in 2009 was expected to “become the largest gas field in the world at 1.5 quadrillion cubic feet” according to former Chesapeake Energy (NYSE:CHK) CEO Aubrey McClendon, has declined precipitously since peaking in 2012. Haynesville production is now down by nearly 50 percent according to data from the Louisiana Department of Natural Resources. To say the field has not lived up to its lofty expectations would be an understatement…..The Fayetteville shale of Arkansas has been on a plateau for much of the past two years due to continued drilling by the play’s biggest operator but will likely see production fall off in the next year as it becomes increasingly mature.”
Here’s where we would like to bring a little economics 101 into the discussion. Haynesville development began when gas prices were closer to $6/MMbtu. Even as natural gas prices fell in the recession, development continued as producers drilled single wells per section to hold acreage as an option for future development when prices rose.
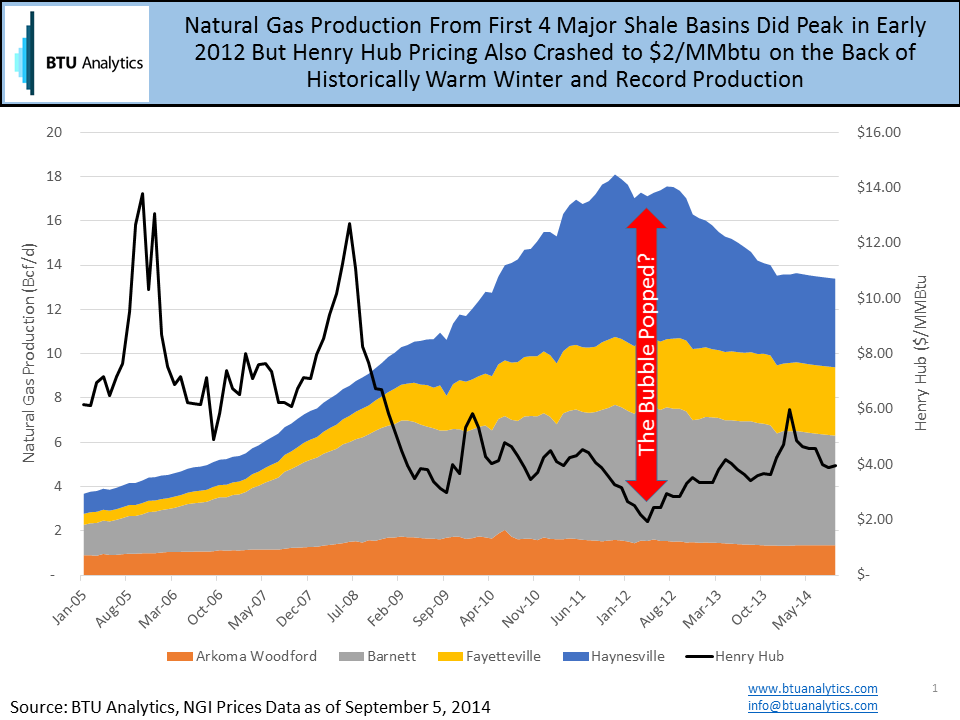
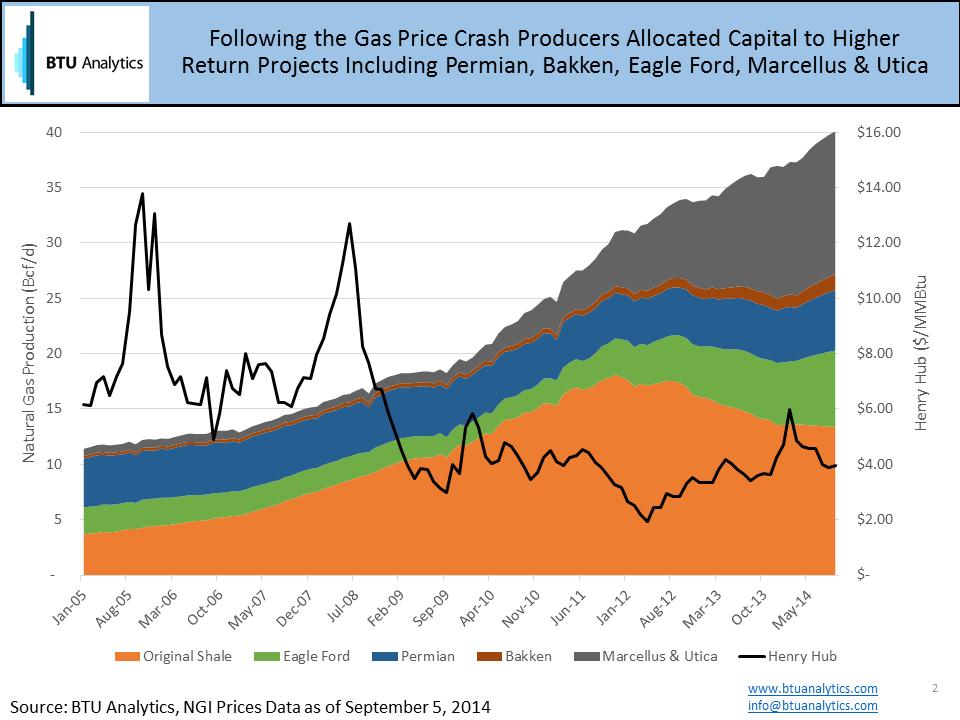
As producers were developing the Haynesville, the practices learned in that play were being dispersed to other regions in turn lowering the marginal cost of production in other plays (these plays are not mentioned in the article). The dry gas play in the Marcellus provided even better economics than the Haynesville. In addition, the price differential on an energy equivalent basis between natural gas and oil prompted producers to shift their focus from plays that produced only dry gas to plays such as the Eagle Ford, Bakken, Permian, and Utica. While drilling for oil and natural gas liquids, producers were also producing a lot of associated gas, and those volumes, along with the low cost Marcellus more than offset production declines in the “Original Shales”. To summarize, lower cost production made the earliest shale plays less competitve. This does not constitute a bubble in our eyes. The Haynesville will be drilled again at some point in the future once the prime acreage in these more competitive plays has been drilled and produced…that just may be a few decades from now.
The author then goes on to tie dated natural gas price and market analogues to today’s market.
“For example, between 1973 and 1984 the average US price for natural gas rose from $.22 per thousand cubic feet (mcf) to $2.66 per mcf, while production dropped an incredible 19 percent. More recently, US production fell between 2001 and 2007 despite a 50 percent increase in average prices. Clearly, rising prices are not enough to ensure production growth”
The natural gas market of the 1970s and 1980s was so heavily regulated making comparisons to today just doesn’t work. Production from 2001 to 2007 was still primarily from conventional means as the Barnett only really started to take off in 2005 (see first slide).
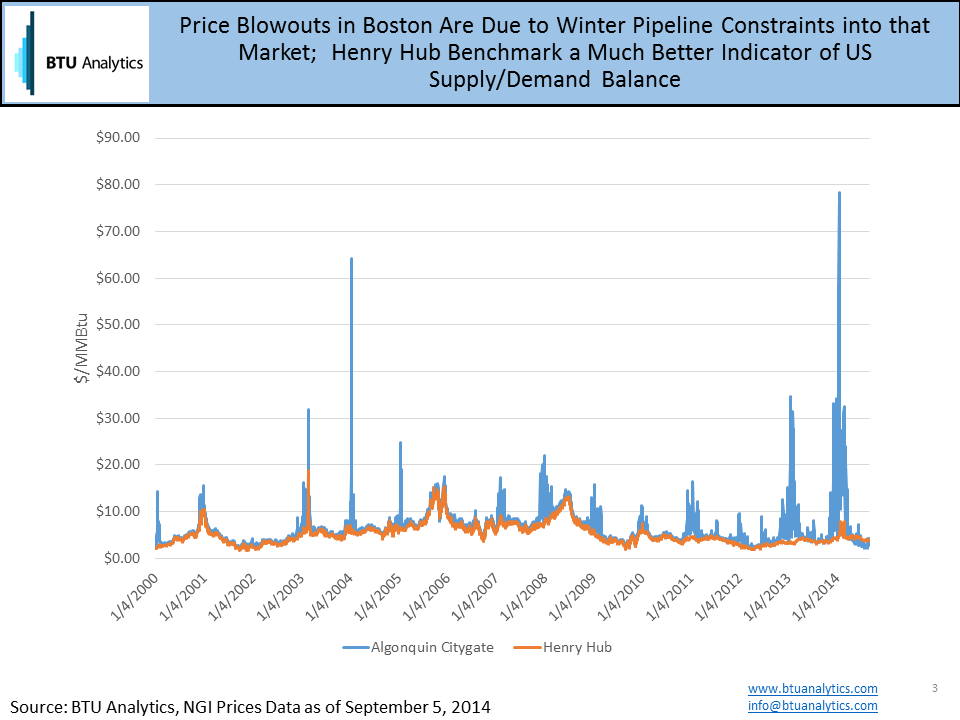
“At one point last winter, spot natural gas for delivery into the Boston area and elsewhere in the Northeast reached over $100 per mcf.”
As anyone who closely follows natural gas infrastructure would tell you, gas prices in Boston on a cold winter day have a lot more to do with an inability to expand pipelines into New England rather than a concern about long term gas supply.
We will leave you with one last message, while an apple falling from a tree could indicate the sky is falling and the end of the world is near, it’s really a better example of how gravity works as Sir Isaac Newton pointed out.
Here is the piece in case you missed it: Popping the Shale Gas Bubble