US liquids production has nearly doubled over the last decade launching the US to surpass Russia and Saudi Arabia to become the world’s largest crude oil producer according to the latest estimates in the EIA’s Short-Term Energy Outlook. However, US growth has come from an industry that widely outspent the cash it generated during the shale boom. With crude prices once again exceeding wellhead breakevens across the US, will capital discipline hang heavy over the industry and dictate the pace of US growth?
Shale development is capital intensive, and internally generated cash flow is the largest and most reliable source of capital for the E&P industry. Modeling the reinvestment implications of industry generated cash flow is a useful tool for understanding the possible future trajectory of US production. The chart below highlights that if 100% of operational cash flow was reinvested into drilling new wells and downstream constraints were not taken into account, then by the end of 2023, US Lower 48 oil production could reach 30 MMb/d. Conversely, if only 70% of generated cash flow was allocated back to drilling programs, the production trajectory would be very different and result in 16 MMb/d by the end of 2023. So what is more realistic? Well, it’s complicated.
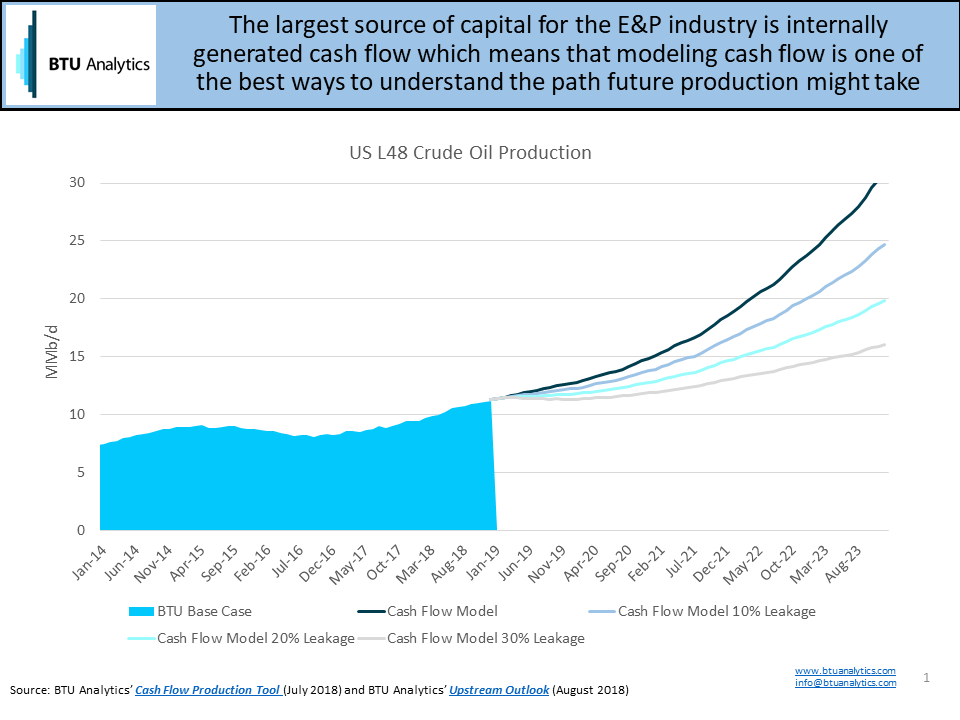
Beyond cash flow, infrastructure constraints and other factors will also dictate individual operator production growth. And investors are making new demands of public E&P producers, including paying dividends, instituting share buybacks, and paying down debt.
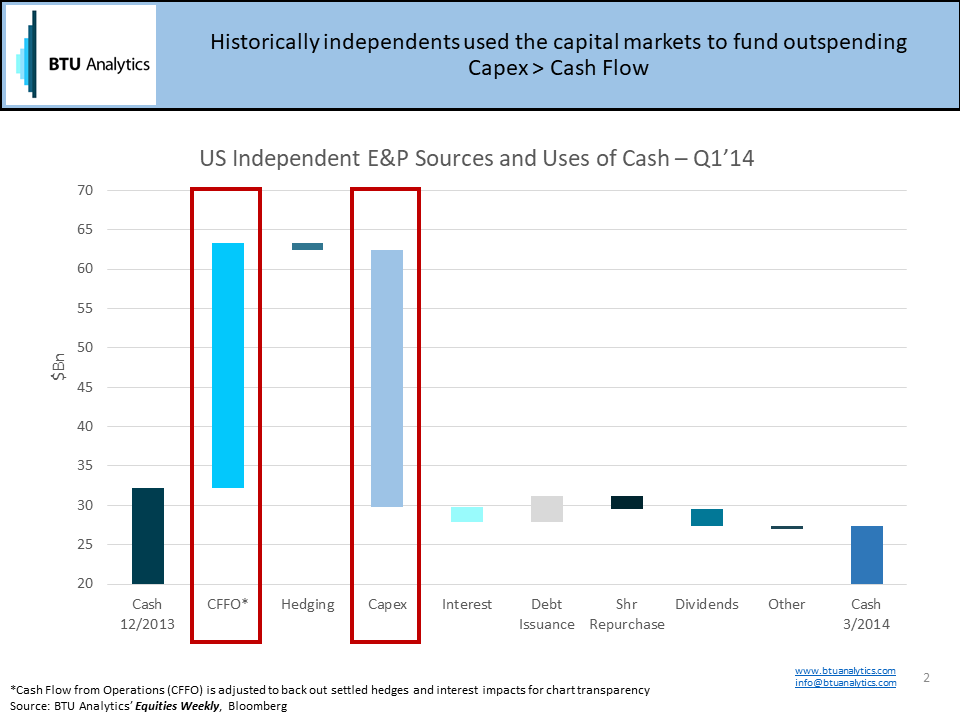
For example, looking at US Independent E&P sources and uses of cash in Q1’14 highlights that prior to oil prices collapsing in late 2014, CapEx budgets were almost always larger than cash flow from operations, leaving producers reliant on outside capital to fund production growth.
Fast forward to Q1’18 and the chart changes dramatically. At the behest of investors, E&P companies have been moving towards practicing capital discipline. In fact, for the fifty-five public producers BTU looked at as part of this study, the group did not have CapEx budgets larger than cash flow from operations and used cash to pay down debt, buy back shares, and issue dividends. The chart below from Q1’18 highlights that CapEx was less than cash flow from operations and that significant amounts of cash went primarily towards interest payments and share repurchase programs. Companies leading this charge included Anadarko, Pioneer, and Devon.
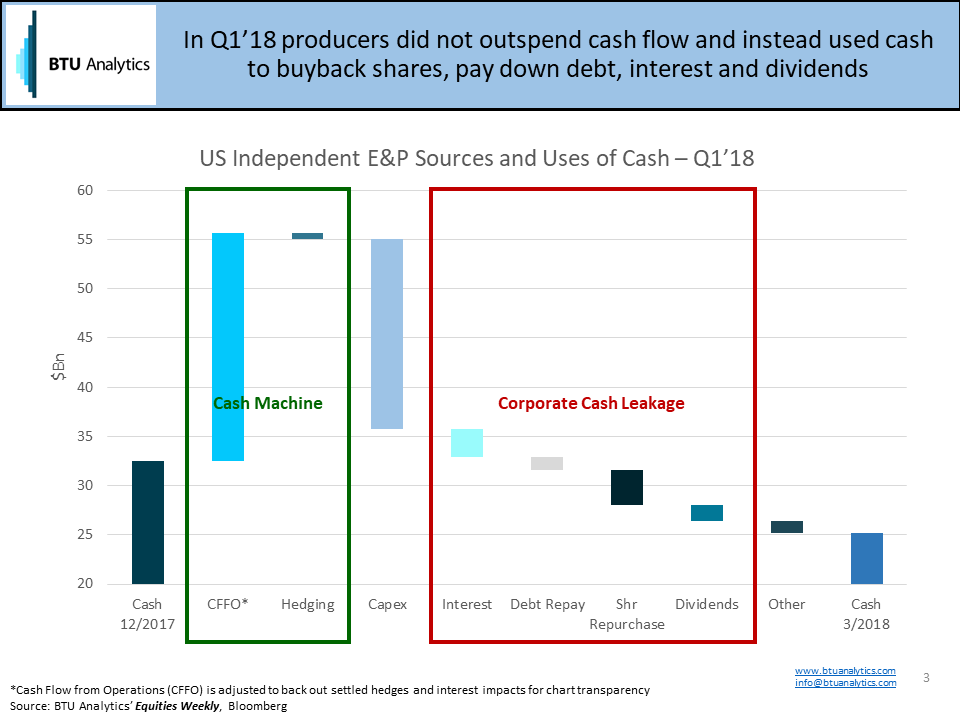
In fact, in Q1’18, 40% of cash was siphoned off for purposes other than drilling. If this trend continues, all else equal, the production trajectory for the US could be much more muted as highlighted in the first chart illustrating the different production paths based on a cash flow model.
However, memories are short and cash flow trends vary by both region and commodity, with many US basins driving headlong into infrastructure constraints. These constraints are driving weakness in regional differentials, leaving many left making the decision about whether to push ahead with production growth in a constructive pricing environment or continue to heed investor pressure to maintain capital discipline to the detriment of production growth. For more on BTU Analytics’ production outlook which takes into account additional factors like infrastructure, producer portfolios, and pricing, request a copy of BTU Analytics’ Upstream Outlook report.