In the data-driven upstream sector, there are few things that E&Ps are better at than interpreting data, implementing swift strategy changes, and highlighting early successes. However, how often do public producers keep score long term? Following the Permian land grab of 2016 to 2018 where E&Ps spent billions to expand acreage holdings, E&Ps focused on maximizing the NPV of those expensive acres by tightening well spacing. This strategy would allow producers to squeeze as many hydrocarbons out of the reservoir as possible, even if it included minor sacrifices to well-level productivity, while also alleviating any concerns around their long-term drilling runway. When well results illuminated that in some cases the tighter spacing led to lower productivity, whether that be from more frac hits or other parent-child issues, E&Ps reversed course. BTU Analytics highlighted this issue multiple times in the monthly Upstream Outlook as well as this Energy Insight focusing on the potential for tightly-spaced DUCs to be stranded. Since then, a global pandemic has upended the E&P space, resulting in a much lower run rate of activity as well as an acceleration in industry consolidation. Therefore, there are now several, much larger acreage holders that are generally more hesitant to return to significant production growth. Tasked with maximizing the return on newly deployed capex, E&Ps have widened well spacing, which all else equal would be expected to drive improved well productivity. Today’s Energy Insight analyzes whether that is occurring, and which operators are driving the shift.
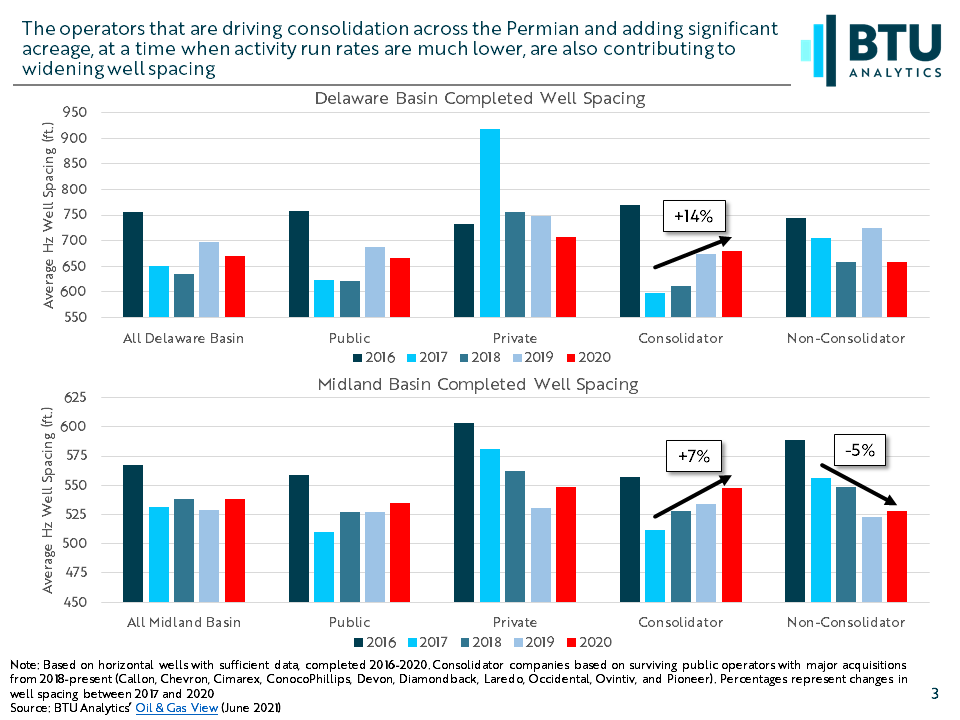
The chart below breaks down the average spacing on horizontal wells between the Delaware and Midland. As expected, public producers have generally widened their spacing since 2017, when most tested their tightest well spacing. Over that same period private producers have continued to test tighter spacing, likely driven by a continued delineation of acreage as they position for a potential buyout. However, simply grouping these producers into public and private may not give much insight for tomorrow, as several public E&Ps have been swallowed up in recent months, including QEP, Concho, Parsley, WPX, and Noble, among others. Grouping together the surviving operators that have driven consolidation in recent years, and therefore activity into the future, reveals a much clearer trend in the gradual widening of well spacing. Consolidating companies have widened well spacing by 14% in the Delaware and 7% in the Midland between 2017 and 2020. This distinction is not quite a catch all. EOG has not participated in significant consolidation, but has seen its average spacing in the Delaware widen since 2017. Alternatively, Diamondback has purchased QEP, Guidon, and Energen since 2018, but continues to test tighter spacing in the Midland.
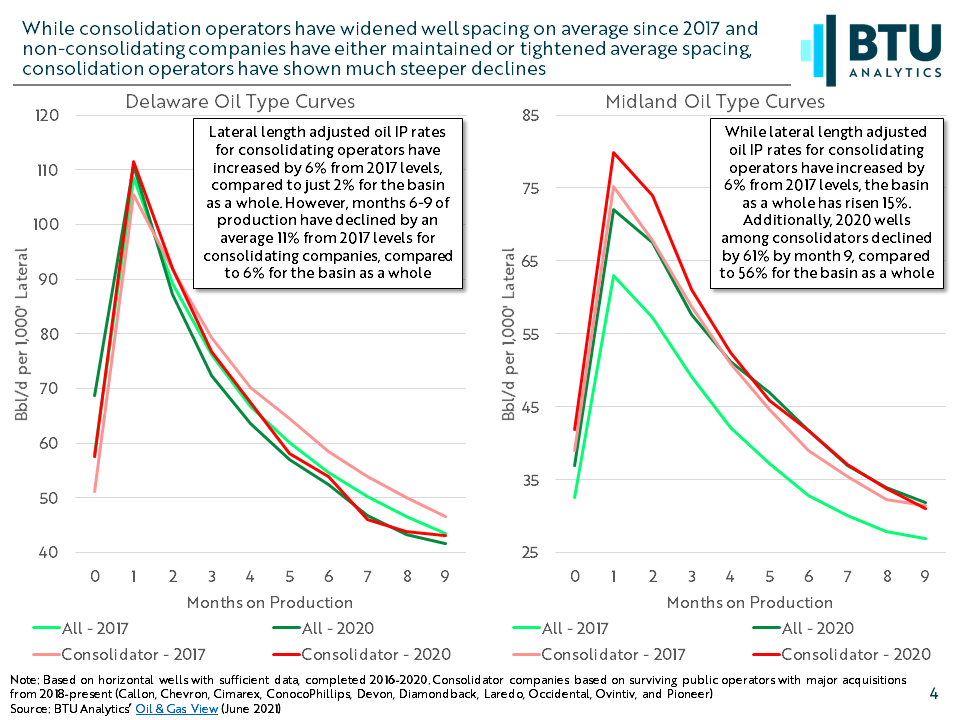
Intuitively, one might assume that this wider spacing equates to more accessible reservoir per well, less potential for frac hits and thus result in greater productivity. The chart below, which breaks out average lateral length-adjusted oil type curves in 2017 and 2020, shows how productivity has been much more muddled for those consolidating operators. In the Delaware, oil production declines among adjusted 2020 wells are increasing compared to 2020. While lateral length adjusted oil IP rates for consolidating operators have increased by 6% from 2017 to 2020, average production in months 6-9 of the life of the well show a decline of 11% from 2017 levels. This is likely impacted by increased average size of well pads over this time but declines in this group significantly outpace those of that basin as a whole. In the Midland, IP rates among consolidating companies continue to increase, but much slower than the entire basin. Lateral length adjusted oil IP rates for consolidating operators have increased by 6% from 2017 levels, the Midland in total has risen 15%. Additionally, 2020 wells among consolidators declined by 61% by month 9, compared to 56% for the basin as a whole. As a result, EURs are likely to be impacted. After adjusting for lateral lengths, 12-month production in the Delaware declined by 6% for consolidating companies from 2017 to 2020, compared to a 4% decline among the entire basin. In the Midland, 12-month adjusted production increased by just 4% for consolidating companies compared to a 19% increase across the basin.
Producers have in part backstopped these productivity challenges through longer laterals, but doing so, combined with wider spacing, ends up chewing up unused reservoir much more quickly. With the consolidating companies of today likely to be drivers of tomorrow’s production in the Permian, oil production growth may be more difficult than the market is currently expecting, especially as well pads continue to grow. To see how BTU Analytics expects the Permian Basin to grow over the next five years, inquire about our Upstream Outlook. To analyze BTU Analytics’ proprietary well level production data, request a demo of the Oil & Gas View.