Over the last several years, US oil production has fundamentally altered the global supply stack and helped meet growing global demand. However, $30/bbl crude prices do not allow US shale production to be economically viable. The real question is what price does make US shale viable? Since 2017, only 16% of US horizontal oil production brought online had a breakeven below $30/bbl. Therefore, higher prices are needed long term to foster investment in US oil. The questions are, what is that price, and how much activity do we need to offset declines or return to growth. A good starting point to look at this is to see what would happen to production if producers stopped drilling.
If US producers stopped completing wells tomorrow, average 2020 oil production would come in just under 1.5 MMb/d lower than 2019 production. Given the US contributes significantly to global liquids supply, it becomes necessary that US producers return to drilling and completing wells beyond the near-term, even just to maintain production levels. For reference, a cut of approximately 40% from average 2019 activity levels in 2020 leads to flat production average 2020 relative to average 2019, as seen below.
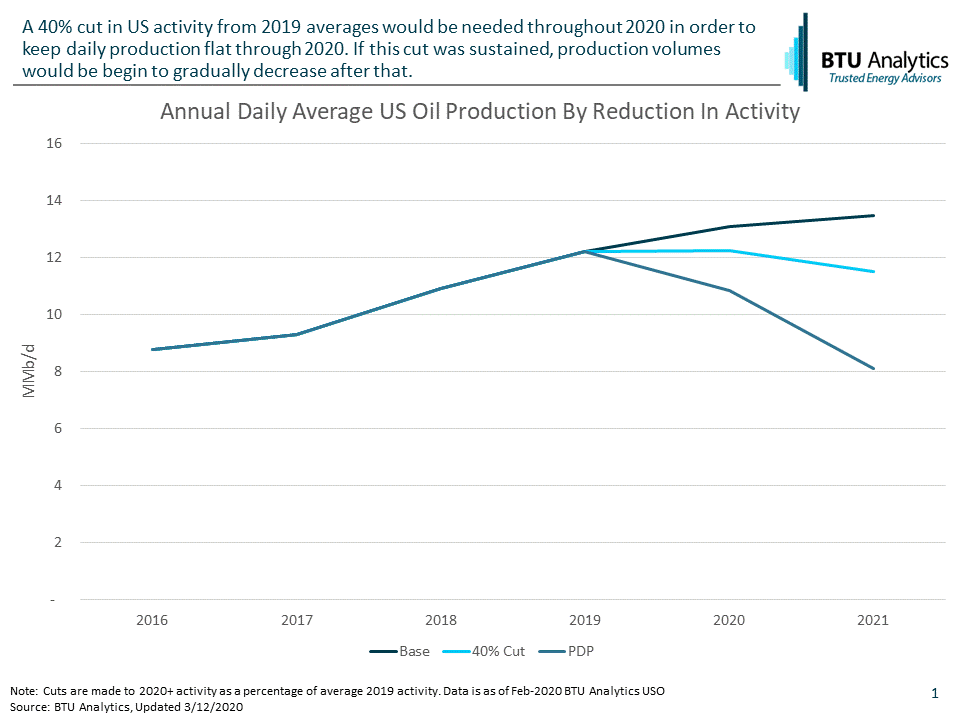 At sustained $30 crude, early operator announcements suggest activity cuts of 40% (at least in the near term) are not unrealistic, and we can see from the above chart that staying at the 40% reduced level of activity relative to 2019 will cause US production to actually decline after 2020. So what does this mean for 2020 production, and what is the longer term price needed to support US shale? One way of looking at this is to peek into the economics of US shale production. Below is a breakdown of new US production by half-cycle breakevens, represented as a percentage of new US production for that time frame.
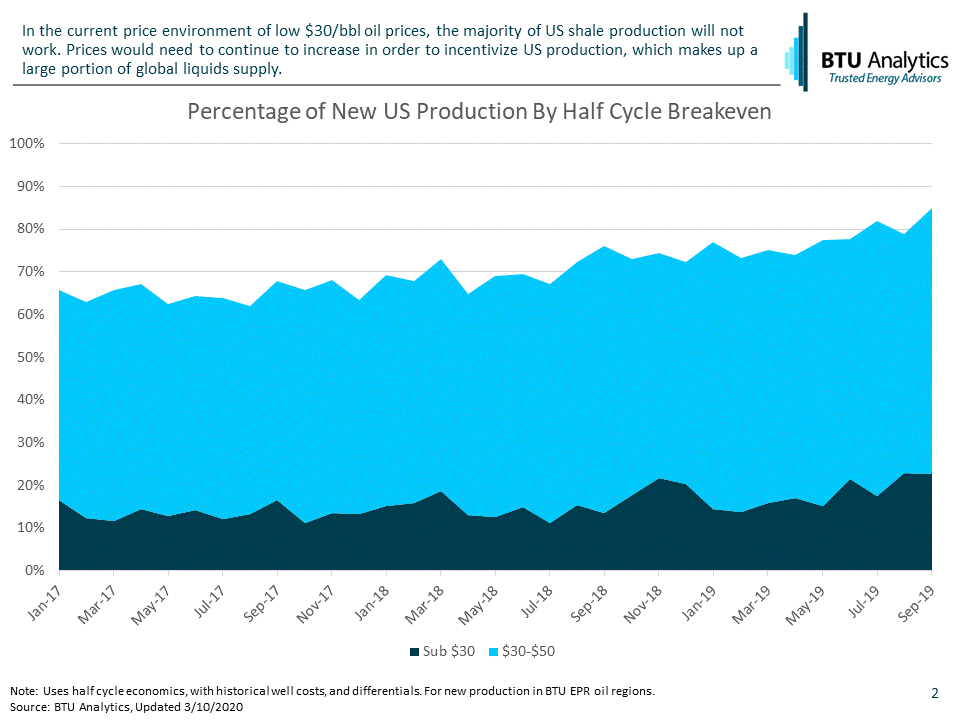
It is worth noting these breakevens are half cycle, meaning costs like SG&A, interest, and acreage costs are not included and would be additional costs needing to be factored into those breakeven prices (across public operators these corporate costs were roughly $5/bbl for 2019, on average).
What we can see is about 16% of new US production historically broke even at $30/bbl oil, before factoring in additional corporate costs. Thinking about this a different way, if US producers were to cut out all activity that was not economic at $30 crude, we would have around an 84% decline in activity, more than double what we saw previously would keep production flat. This would continue to decrease production even more in the out years and is unsustainable in the long term as global demand growth returns to normal historical levels.
Looking at the remainder of the chart, we can see that around 70-80% of new production was economic at sub $50/bbl prices, which were the levels we were seeing before the start of this recent oil price war between Saudi Arabia and Russia. This would point to the fact that even higher prices would be needed to keep US production growing to meet new demand.
So what price level would we need to see in order to keep production flat year-over-year? What kind of capital expenditures would we need to see at those price levels to return to growth? How do individual operators and basins fare in a $30, $40, or $50/bbl price environment? Get the answers to your questions through our new service, BTU View. Also, BTU Analytics is currently offering all of our existing clients one-on-one webinars with our latest thoughts on the outlook for gas and oil markets in this rapidly evolving market. If you are not currently a client but would like to schedule a one-on-one presentation, please submit an inquiry HERE.