The importance of capital efficiency has arguably never been greater for U.S. independent E&Ps and their shareholders in the shale era than it is currently. But the idea that a large swath of E&Ps are actually able to operate within cash flow while maintaining modest production growth seems unlikely, given the rampant outspend in the industry during the shale era, as we highlighted back in 2015. However, the buildup of DUCs in important shale basins offer an important lever that producers can pull in order to meet capital efficiency demands, as roughly 30% of total well cost is associated with drilling the wellbore. We have discussed the impact of DUCs for quite some time, but today we ask a new question– do DUCs have a shelf-life?
Producers have indicated that one way they plan to increase production efficiency is to focus on development (as opposed to exploratory drilling) in stacked pay potential basins like the Permian, SCOOP and STACK. The Permian has racked up the largest DUC inventory among major shale basins since the late-2014 oil price collapse, so that should make meeting cash flow neutrality goals fairly easy to achieve, correct? Think again, because not all DUCs are created equal.
BTU Analytics provides counts and forecasts for DUCs well out into the future in our U.S. Upstream Outlook. However, for this post, we have simplified the analysis to focus on historical DUCs created by wells drilled since 2012. Additionally, given lags in production and completion records provided to the states, we’ll look at DUCs as of March 31, 2017. This will allow us to attach an API number to every DUC in our sample, as well as gather data on well vintage, location and operator. The chart below shows the Permian DUC inventory as of March 31, based on the year each well was drilled.
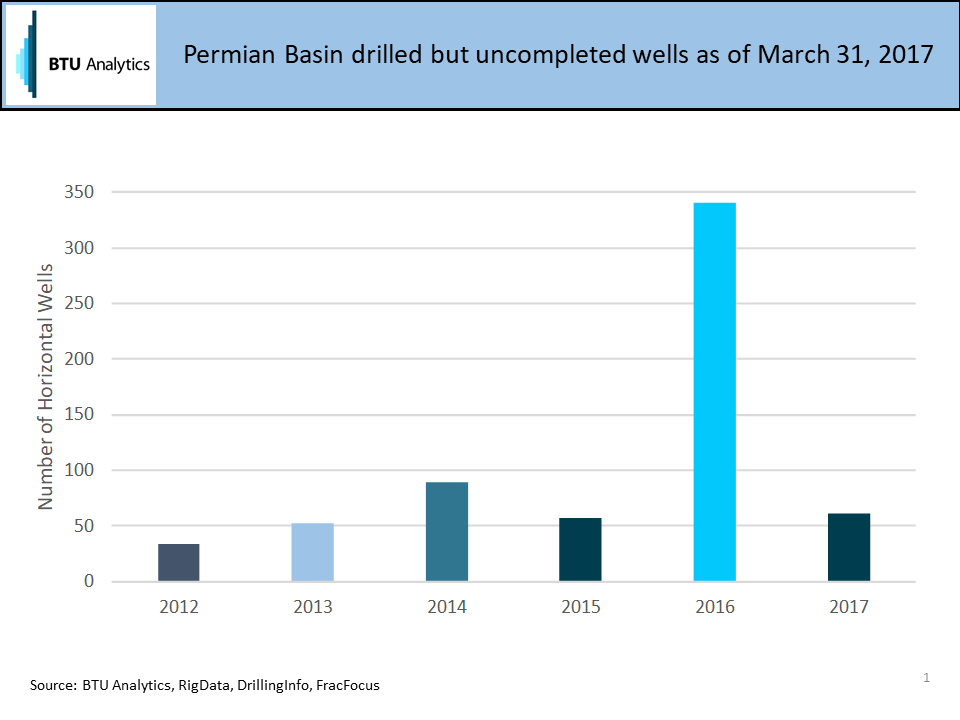
More than half of these DUCs are 2016-vintage wells, but a whopping 37% were drilled between 2012 and 2015. Given the massive progression in well design since then, these wells could either be left uncompleted for good, or completed at materially different economics than their more modern counterparts.
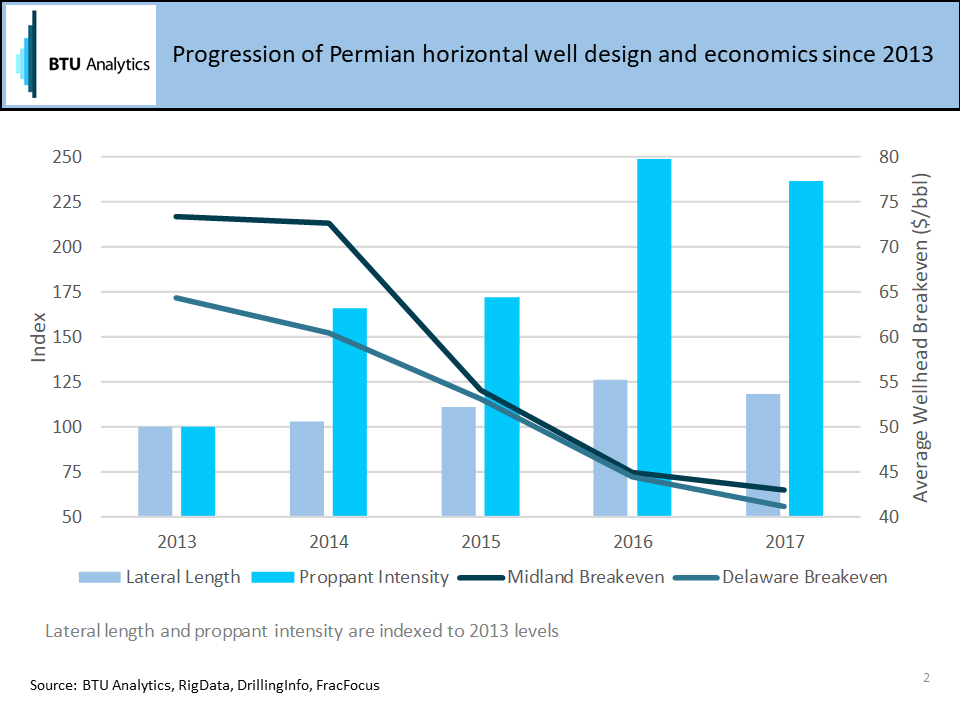
It’s no secret that the oil price downturn has sparked innovation in terms of well design, with longer laterals, greater proppant intensity and more complex completions improving well economics across the U.S. The chart below shows the progression in average breakevens in the Midland and Delaware as lateral lengths and proppant use grew, based on what year the well was spud. The largest improvements in breakevens came in 2015, due in part to rapid declines in service costs, and 2016, where the effects of improved well design surface in the data en masse. Lateral lengths in 2016 were more than 25% longer than those in 2013. It’s important to note that the decrease in lateral lengths and proppant intensity in 2017 vs. 2016 is based on a relatively small number of 2017 data points, as production and completion records are lagged.
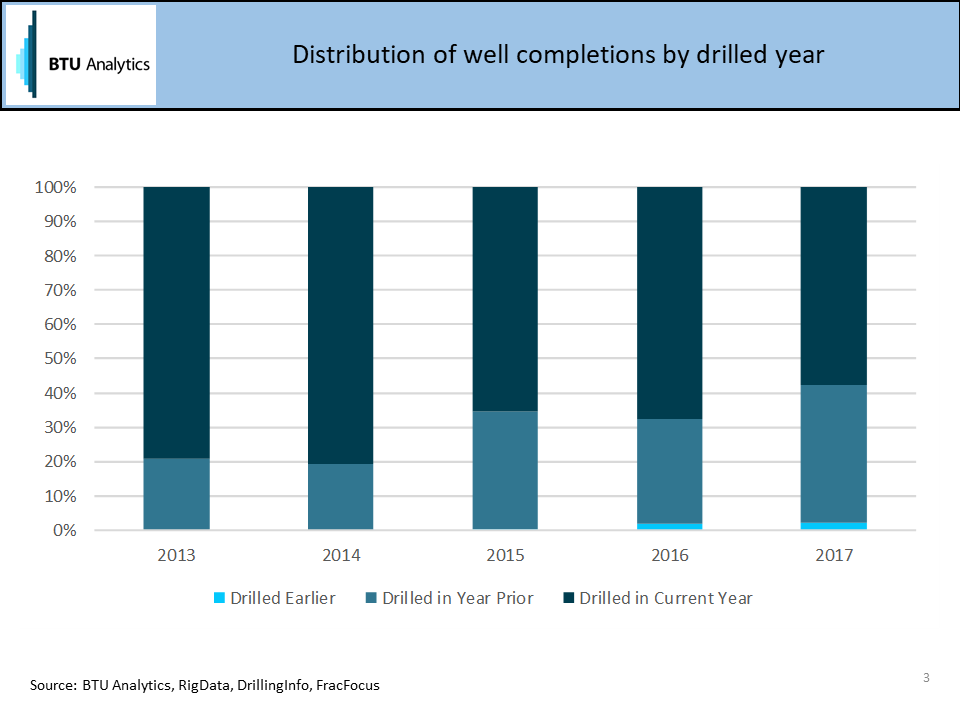
Data shows that producers have been focused on completing wells drilled in the current or previous year, as shown by the chart below. 98% of the wells completed in 2016 are either from 2015 or 2016 drilled wells. Of data available on 2017 completions, which is fairly lagged, 98% of wells completed were drilled in either 2016 or 2017.
This could suggest that improvements in wellbore design (since any wells can be completed with a modern frac) have pushed some older wells to become ‘obsolete’ after a maximum of two years. This would mean that 37% of 2012-2017 DUCs as of March 31st may never be completed, overstating the true impact this lever will have on capital efficiency. These DUCs may not be abandoned due strictly to lateral length, mechanical problems with the well bore, drilling out of zone, or low expectations on the economics that would be achieved by completing the well all could lead to the well being abandoned. Soon we will need to decide if these ‘forgotten children’ are still DUCs, and not just the dry-hole of the shale era.
Does BTU see Permian DUCs growing in the future, and how does this well inventory affect production in the region? Request a copy of the U.S. Upstream Outlook today.