


It’s no surprise that production in the Haynesville is at its lowest levels in five years. After peaking at around 7 Bcf/d, the Haynesville has been pushed out of the market due to lower cost supply in the Marcellus, Utica and associated gas from oil production. Production out of the Haynesville now averages 3 Bcf/d. However, current weakness in oil prices could provide hope for dry gas plays. Additionally, pipeline constraints limit the ability of Northeast gas to come to the rescue should demand outpace supply. BTU Analytics revisited Haynesville economics to analyze if the play becomes a good option in this low price environment.
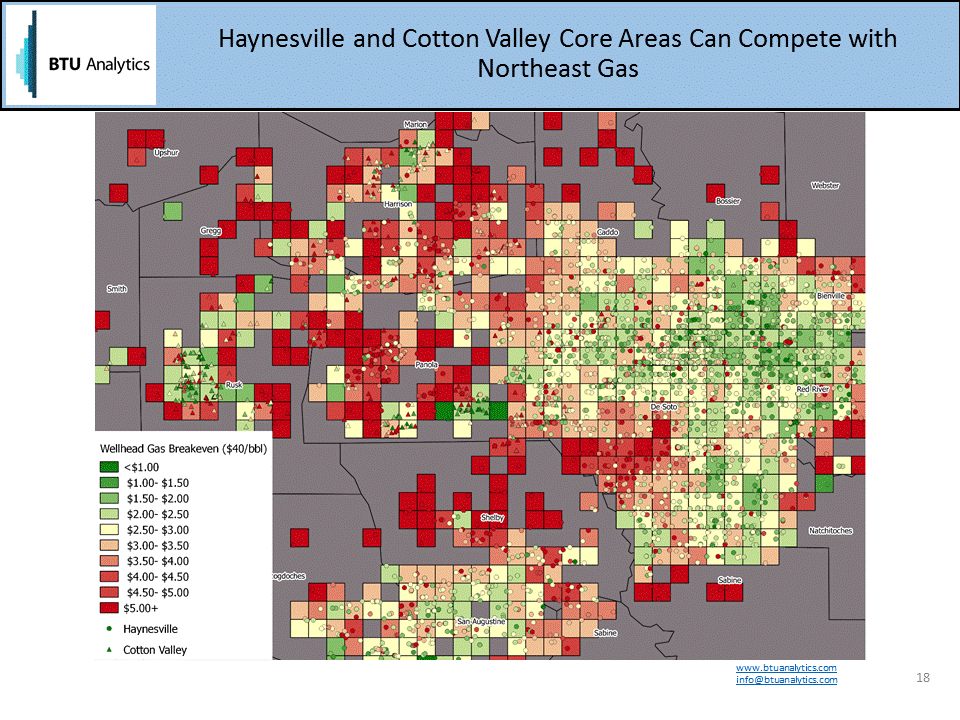
Using BTU Analytics’ proprietary economics model that estimates well costs based on well characteristics such as lateral length, proppant usage, and operator as well as production reported to the state, we are able to create the map shown above which identifies the lowest cost core acreage of the play. What can be seen is that there are plenty of areas in the Haynesville with breakeven wellhead prices that are well above $5.00/MMbtu, a price that would be over double the level at which Henry Hub currently trades. On the flip side, there are plenty of regions that break even in the $1.50 – $3.00/MMbtu range (note that there are few regions that break even below $1.50/MMbtu). The best parts of the Haynesville can compete with Northeast production from a wellhead breakeven basis. Of course, one must also consider how much inventory is actually left in the Haynesville, as this region was heavily drilled during the early days of the shale revolution. Our analysis indicates that only 20% of well locations that break even sub $2.00/MMbtu have been drilled to date (177 wells). As oil prices continue to stay low, and associated gas production falls, dry plays such as the Haynesville may again become viable investment opportunities, especially if incremental supply from the Northeast is unavailable due to capacity constraints.
On a monthly basis, BTU Analytics’ Upstream Outlook explores numerous dynamics shaping today’s, and the future’s, upstream market. Click HERE to learn more.


