As E&P investors search for their next investment, they should be wary of company presentations touting the company’s latest and normalized results. During the training of new industry analysts, there comes a time when each presents a piece of analysis based on data sourced exclusively from an E&P investor presentation. When asked if the analyst verified the initial production rates or cross checked assumptions against others developing similar assets, the analyst looks dumbfounded. “But this is what the company presentation showed?!”.
New analysts aren’t the only ones prone to this confusion. BTU Analytics consults for a number of financially sophisticated clients looking to make large investments in the energy space, and many initially question how it is possible that our analysis brings different results than what is reported by E&P producers. Early in my career, my first experiences in the job market included positions in both banking and investor relations. Much of my time was spent mining data for the perfect statistic that would help my company or client reinforce their brand and define their position in the market in the most appealing light. (We have the best wells! Footnote: Only includes wells drilled in the eastern part of the county on Thursdays in March.)
Today’s analysis shows how a company can present a message to E&P investors that, while factually true, may choose to leave out information that could muddle an otherwise appealing message.
Please note that although we chose a single company as an example for this blog, almost no company is immune from selectively communicating information that puts their best foot forward. And honestly, investor presentations are mostly marketing materials to sell the company’s stock, so ‘fair and balanced’ shouldn’t be the expectation. We aren’t suggesting any wrongdoing, just that investors should ask good questions, read footnotes and verify information presented. The company chosen as today’s example is far from one of the worst offenders.
The slide below was found in Goodrich Petroleum’s investor presentation from January 26, 2016. It shows what is identified as a ‘current type curve’ for shorter laterals (4,600′) in the Haynesville shale. There are few footnotes to identify whether the type curve applies to a broad area or a selected area, so it makes sense to cast a wide net to try to corroborate the type curve.

The chart below shows production performance for all horizontal operated by Goodrich in the counties the company has identified as being part of the Haynesville region that are marked as being in the Haynesville reservoir.
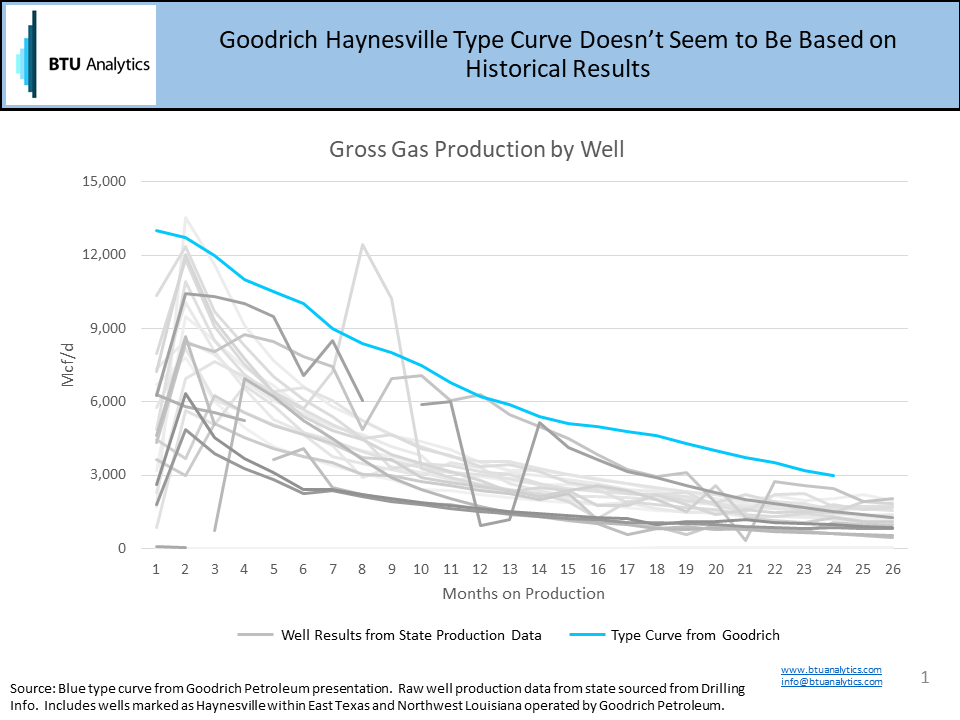
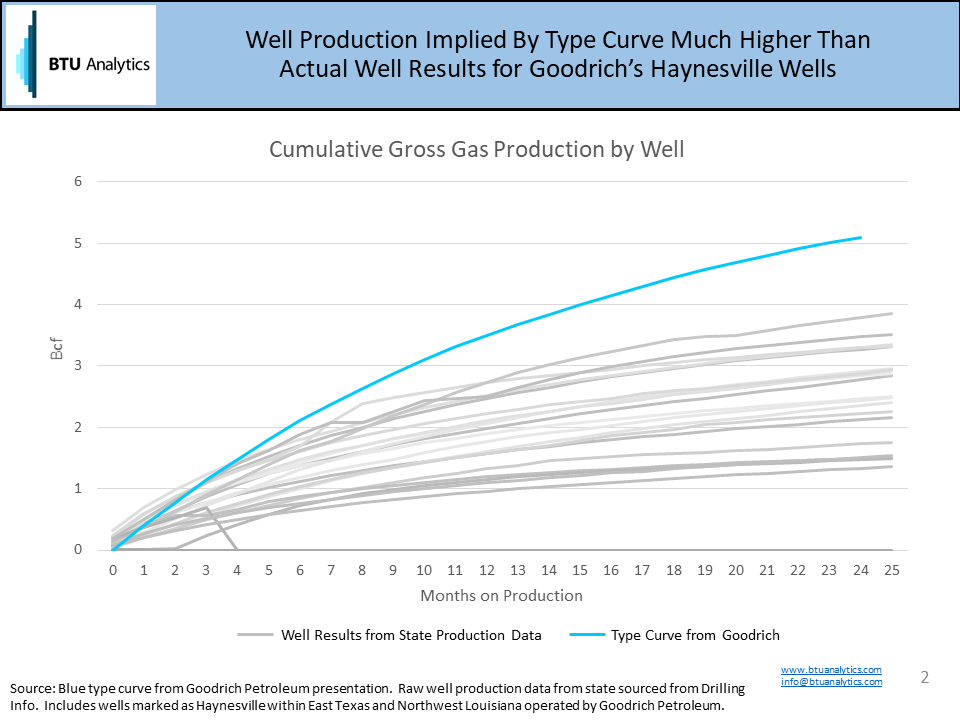
Note that the initial production (IP) rate for the investor deck slide looks to start at about 13 MMcf/d. But only one well out of over twenty in the historical data set shows first month production that high. That isn’t necessarily a red flag as the production curve based on the state data very likely shows less than thirty days of production, whereas the Goodrich curve shows 13 MMcf/d as the average for the first thirty days of production. Operators typically report wells in company materials excluding any downtime whereas analysts utilizing state data typically have to assume the well was “on” for the number of days in the month due to lack of consistent reporting of days on production. Additionally, looking at the cumulative production curve implied by Goodrich’s type curve, the IP rate isn’t the only issue. Cumulative production is over 30% higher than even their best performing wells by the end of two years and nearly double the average well performance of the 20 operated wells analyzed.
Since type curves are one of the most essential building blocks of valuation models, variations in type curve assumptions could give a much different view of the company’s assets and value. In this case, using the type curve provided by Goodrich might be completely valid based on results from offsetting operators, or changes in drilling and completion technology since their wells were drilled. But a little due diligence into historical results can provide very useful benchmarks for E&P investors to judge whether claims are conservative, optimistic, or outright crazy.
BTU Analytics provides several reports and data services for benchmarking both individual operator results as well as regional trends. Request a sample of our E&P Positioning Report or Upstream Outlook services for more information.