Earlier this month, an Energy Market Commentary analyzed how many operators rapidly downspaced horizontal drilling activity in 2017, with the hopes of expanding the potential drillable locations within their finite acreage. For some operators, tighter Permian well spacing resulted in lower productivity, prompting them to announce sweeping changes to their spacing assumptions going forward. However, these changes mostly occurred during the first half of 2019, meaning that for nearly two years, some operators have been drilling wells using sub-par spacing assumptions. Given that at the same time the Permian rapidly increased its backlog of drilled but uncompleted wells, today’s analysis will look at which operators have a potentially large backlog of DUCs made up of wells with too tight of spacing. For operators that have rapidly downspaced in 2017 and 2018 and also have a large backlog of DUCs, the negative impacts to well productivity may be long lasting.
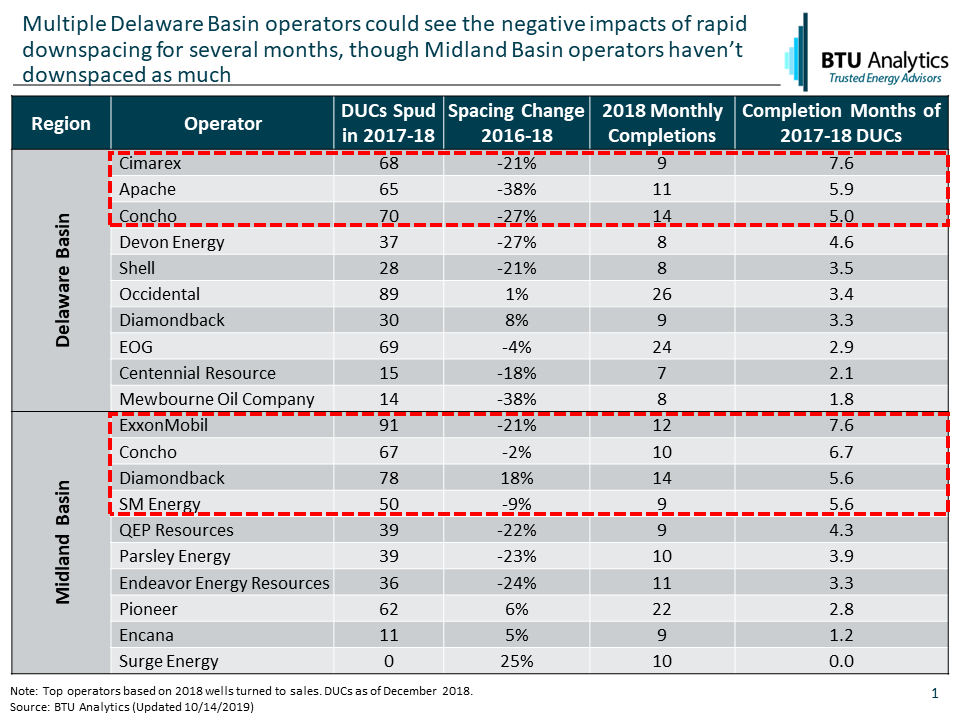
The table below highlights the number of DUCs as of the end of 2018 that were spud in 2017 and 2018 for the top 10 operators in both the Delaware and Midland basins. The table also shows the change in each operator’s average well spacing between 2016 and 2018 and the monthly pace of wells brought to sales in 2018. Using the 2018 pace of wells to sales as a benchmark, we can make an assumption for the number of months of completions that each operator has in its DUC count. In the Delaware, Cimarex, Apache, and Concho have 5 or more months of completions from 2017 and 2018 vintage DUCs. These operators also tightened average spacing by more than 20% between 2016 and 2018. In the Midland, the potential impact to longer term impact from tighter spacing isn’t as clear. ExxonMobil, Concho, Diamondback, and SM Energy have more than 5 months of completions from 2017 and 2018 vintage DUCs. However, only one of those operators, Exxon, shows a tightening in average spacing of more than 10% between 2016 and 2018. Additionally, given that Exxon has significantly increased activity in late 2018 and 2019 to meet its long-term production targets, the 7.6 months of completion is likely artificially inflated.
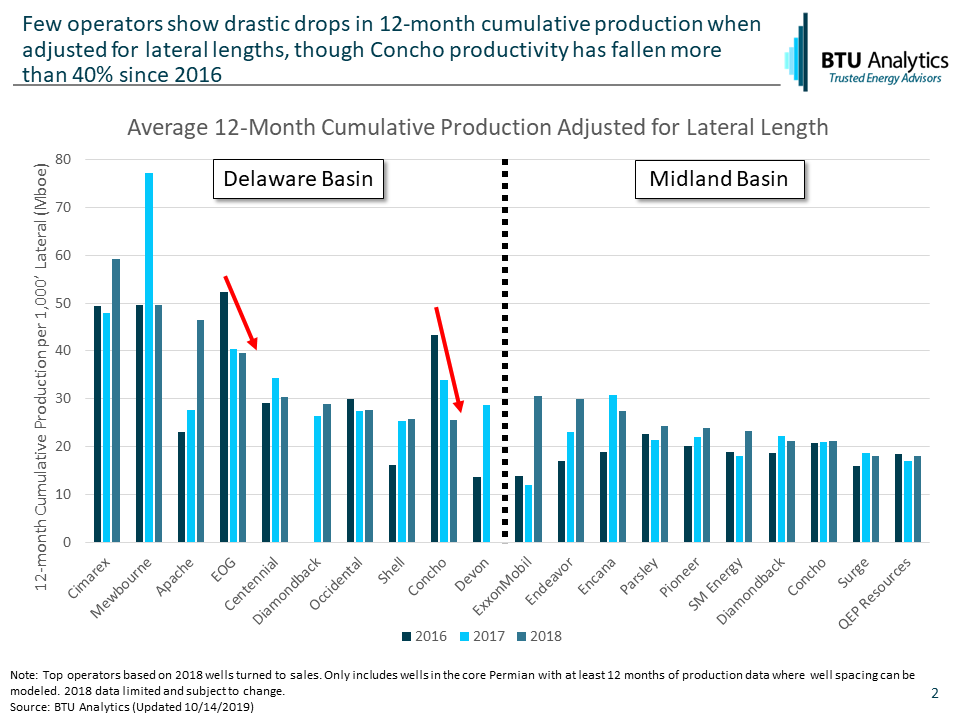
What’s important next is to consider the potential lasting impacts to well productivity that could result from years of tighter spacing. The chart below highlights the changes in well productivity from 2016 to 2018 for the top 10 operators in the Midland and Delaware. Productivity is measured as average 12-month cumulative production per 1,000’ of lateral. This chart only includes wells in the core of the Permian where BTU Analytics’ well spacing model is applicable. In the Midland, most operators have seen steady increases in well productivity since 2016. In the Delaware, most operators have experienced either stagnant or declining productivity over the last couple years. EOG may be experiencing declining productivity as it tests other gassy horizons. Concho, however, saw productivity in its core Permian wells decline by more than 40% between 2016 and 2018. This decline may be attributable to tighter spacing, given that Concho has not significantly changed the horizons it has targeted in its core acreage.
While tighter spacing has certainly made headlines, the lasting impact to well productivity appears to be short-lived for most operators. Only Concho’s Delaware activity looks like it may experience a continued negative impact, given that the data shows 5 months of potential completions with tighter-spaced DUCs, combined with declining productivity over time. However, given that the DUC data is only measured at the end of 2018, some of these wells may have already been completed.
The larger impact to productivity may lie with smaller Permian operators, who, in order to maximize their small acreage holdings, may have been the primary proponents of tighter spacing. The reversal of tighter spacing among Permian operators may also impact the remaining undrilled inventory in the Permian. BTU Analytics has been conservative in tightening its spacing assumptions across the Permian, meaning that modeled undrilled inventory featured in our E&P Positioning Report hasn’t significantly changed. But wider spacing in operators’ development plans could change the pace at which operators drill out their acreage. For more information on how BTU Analytics forecasts Permian Basin production, request a copy of our Upstream Outlook.