If you are a client of BTU, then you know that BTU’s Henry Hub outlook for 2020 currently sits about $0.20 above the 2020 strip. With the market seemingly perpetually bearish, what makes BTU optimistic for higher NYMEX pricing? The answer lies in a shift of perspective and drilling down into the dynamics playing out along the Gulf Coast right now.
Let’s start with how we look at regional gas pricing. When looking at regional pricing, for example, let’s use Opal pricing in the Western Rockies, we take into account a number of factors. What does regional demand look like going forward? What are the economics of producers in the area? And can existing and proposed infrastructure bridge the gap between production and the burner tip? At this point, you probably agree that these factors, and some more, should be considered when formulating an outlook for regional pricing.
Now let’s switch over to Henry Hub pricing, which is used as the US benchmark gas price. Since it’s thought of as a more macro gas price, the considerations going into a Henry Hub price outlook get macroed up as well. What does the Lower 48 demand outlook look like? Considering regional economics and midstream bottlenecks, what is the marginal source of production to meet US demand? While these are typically valid and relevant considerations, given how supply and demand has grown over the past few years, BTU expects Henry Hub pricing to reflect regional rather than macro drivers at key points in 2020.
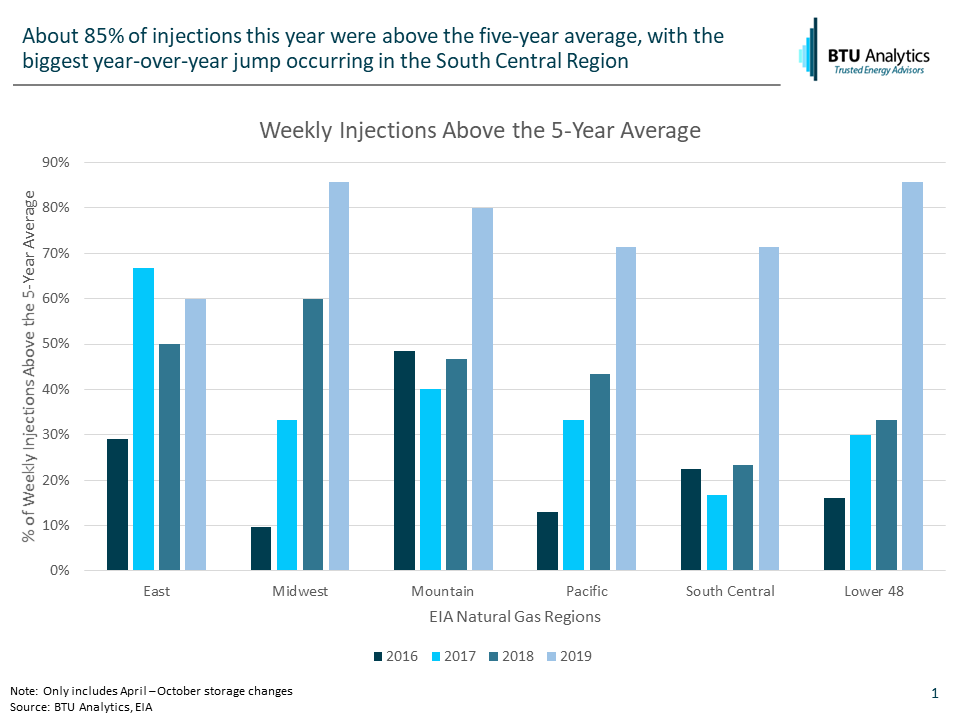
Let’s look back at 2019 for a view of what is to come. On the demand side, LNG feedgas demand grew along the Gulf Coast by about 2.2 Bcf/d summer-over-summer, exports to Mexico kicked up with the start of Sur-de-Texas, and Texas power market hit record loads. On the supply side, north-to-south utilization in Louisiana hit 92% this year, up from about 75% the same time last year, while Gulf Coast Xpress brought an influx of new Permian gas towards the coast. Combined, these factors pushed the Gulf Coast supply and demand into a precarious balance, which storage and price swings were able to help maintain, as shown in the graphic below from our most recent Upstream Outlook.
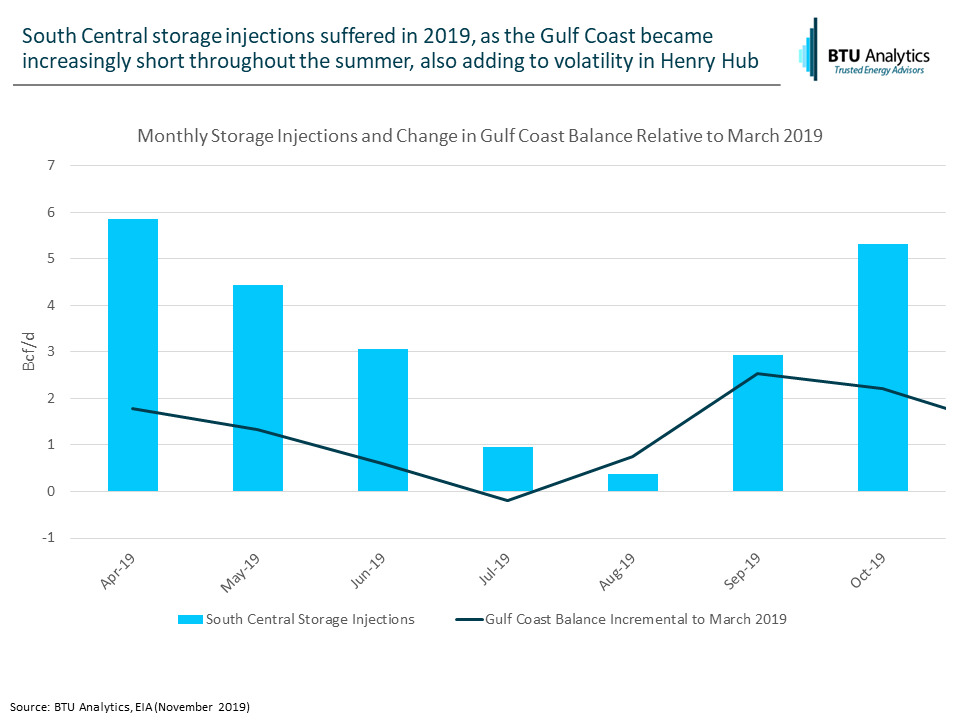
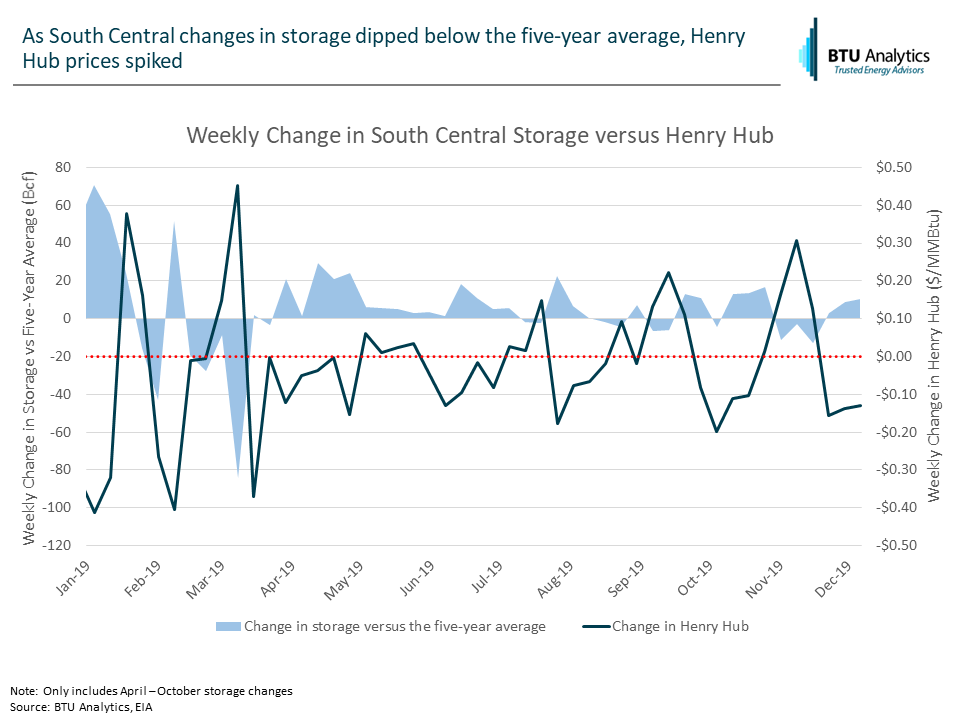
The 2019 injection saw storage inventories rise by 2.62 Tcf, the second strongest injection season since 2010, only to be outdone in 2014 following the polar vortex. Meanwhile, Henry Hub pricing reacted most in-line with movements in the EIA defined South Central storage, reflecting Gulf Coast regional dynamics.
With Freeport LNG Train 2 ramping up service and three more Gulf Coast trains expected to come online sometime in 2020, the supply and demand balance in the Gulf becomes even more precarious. When can you expect Henry prices to rise and how will this affect adjacent Gulf Coast and supply basin pricing? Reach out to info@BTUAnalytics.com to set up a free, no obligation discussion surrounding our 2020 outlook.