The drop in the crude oil price has much of the industry paralyzed from a strategic planning perspective. “When will this all be over?” is a concern echoed by our clients on a daily basis.
Our answer — not as soon as you hope.
With 2015 budgeting announcements slowly trickling out, and capital expenditure cuts generally falling in the 20-40% range, the industry is clamoring to understand when production growth will start to stall.
A simple first pass at the analysis might lead an analyst down the following path — a 30% cut in capital spending will mean 30% fewer rigs in the field and will eventually mean a 30% drop in new production.
That simple analysis, unfortunately, falls short on many levels since it ignores several major trends. The first is that rigs are a poor indicator of future production, since rig productivity as measured by the days it takes to drill a well has changed dramatically over time. For this reason, BTU Analytics focuses on well counts rather than rig counts as a measure of drilling activity. The second major flaw is not taking into account that well productivity also continues to evolve, particularly in many of the major plays that are driving production growth over the next three years. The primary focus of this commentary today is to explain how changing well productivity is expected to impact the market in this environment of sub $60/bbl crude and sub $4/MMbtu natural gas.
Most production forecasts are built on recent average initial production (IP) rates and type curves across an area. Wells that are currently producing are declined according to their well life, new wells assume average initial production rates, etc.
When commodity prices fall, crunching cash flow, producers have less cash to invest and will allocate capital to their highest return assets. We refer to this process as ‘high-grading’ within their portfolios. High-grading can wreak havoc on a production forecast, as both drilling activity and well productivity move in offsetting directions. (Just ask all those forecasters who called for natural gas production to fall in 2012.)
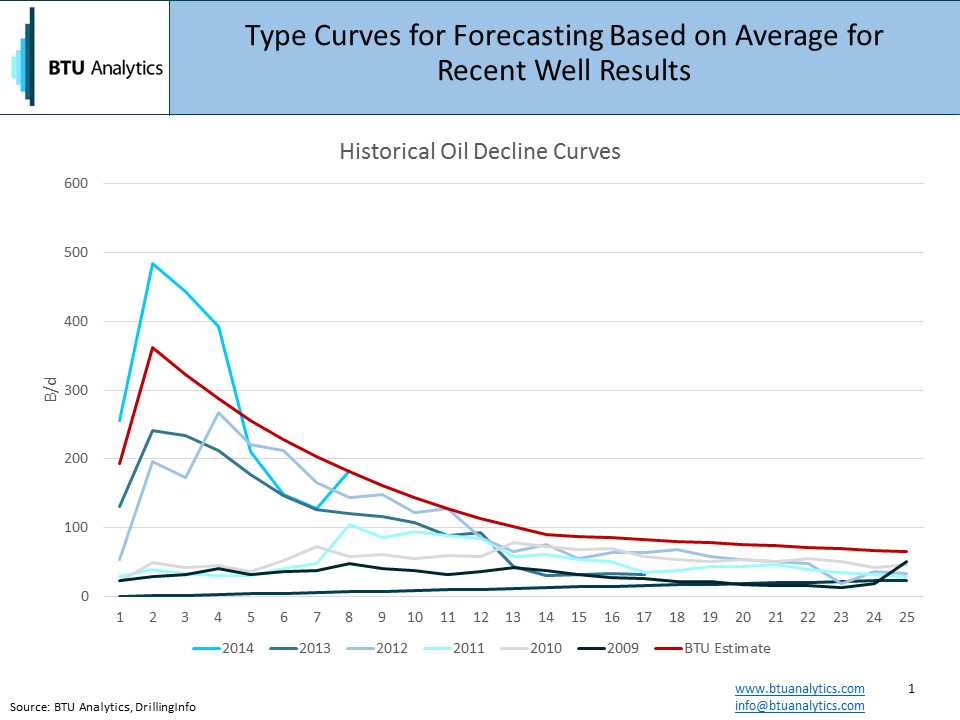
Let’s look at an example that might shed light on how high-grading could affect production over the next few years. The data below shows oil type curves for a single county in the Permian. Notice the change in well productivity over time.
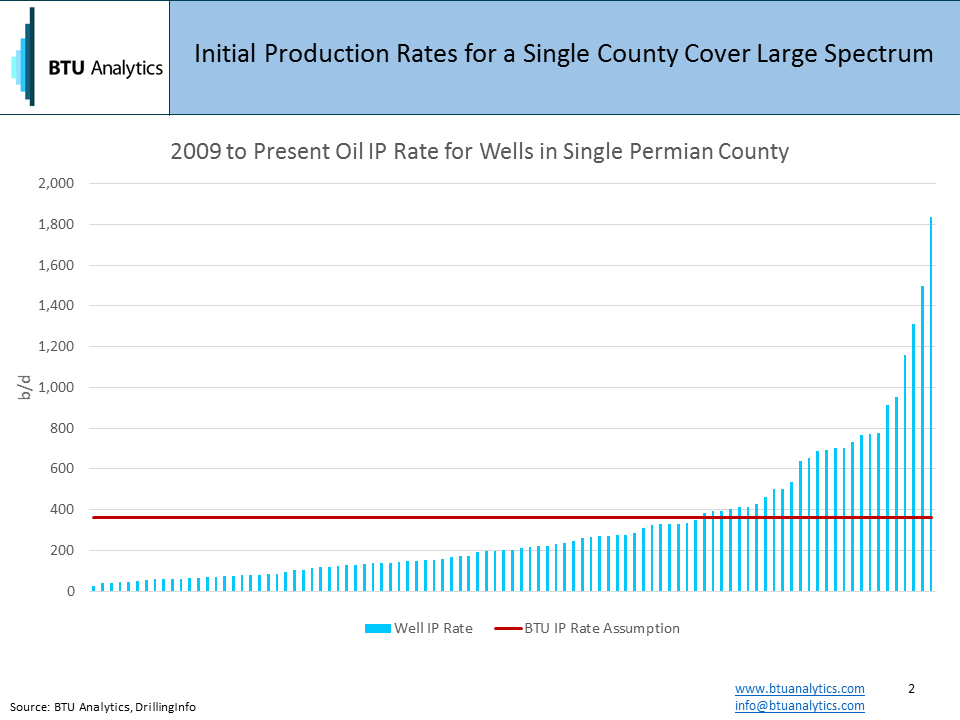
The next chart shows the distribution of initial production rates of oil across all of the horizontal wells drilled in the county over the past 5 years.
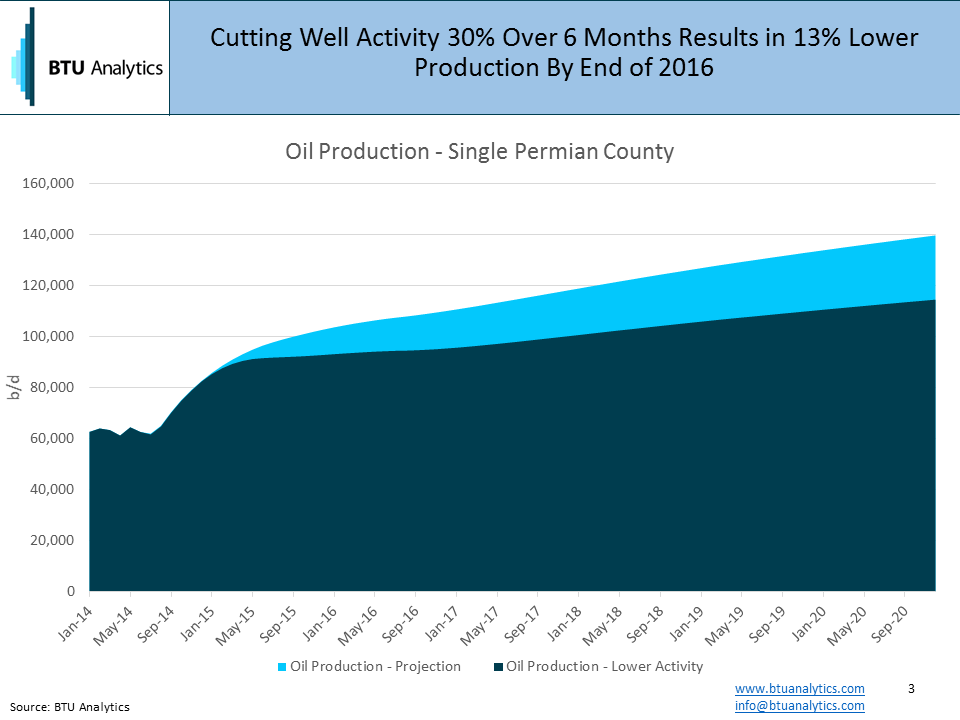
If we were to build an oil production forecast based on current activity over the next 5 years, it would result in production that grows 123%.
Next, let’s assume a 30% decline in well drilling activity that occurs over the next six months. Using the average oil type curve for the basin, production is 10% lower than the previous forecast at the end of 2015, 13% lower at the end of 2016, 15% in 2017, 16% in 2018 and 17% in 2019.
So let’s now factor in high-grading. Rather than using the average IP rate for the county, let’s pick an IP rate that might reflect operators drilling their best acreage. Using a 485 b/d IP rate (which represents average 2014 well performance in the county) along with a 30% decline in activity, we end up with a forecast that is just 2% lower in 2016.
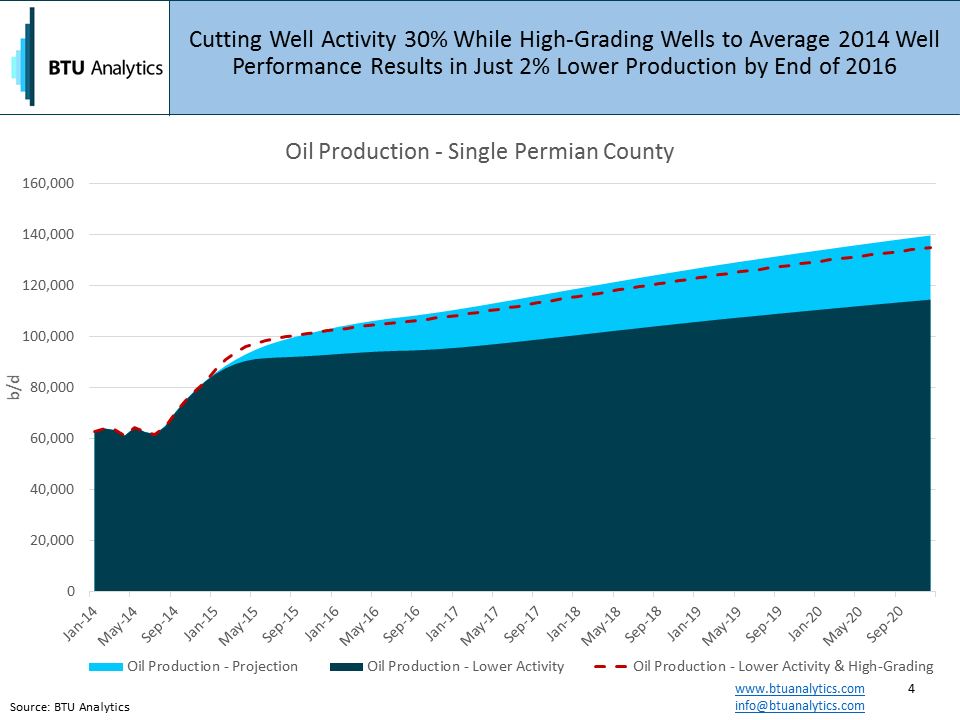
High-grading might seem like the producer’s friend. But to the extent it stands in the way of the market re-balancing, it is going to prolong this period of market pain.
For additional high-grading analysis, Permian break-even analysis and our monthly production forecasts, request a sample of our Upstream Outlook.
Click here to receive our Energy Market Commentary as soon as it’s published