In Summer 2019, the US natural gas market is best summarized as being long supply and short demand. Looking at the demand side, exports in the form of LNG and Mexican exports grab all the headlines due to their scale and growth. Exports now represent 9.8 Bcf/d or 10% of US demand. That being said, the US gas market needs every bit of remaining demand from residential, commercial, power, and industrial demand. This Energy Market Commentary will take a look at the component of gas demand that does not grab as many headlines but slowly and steadily moves higher: industrial demand.
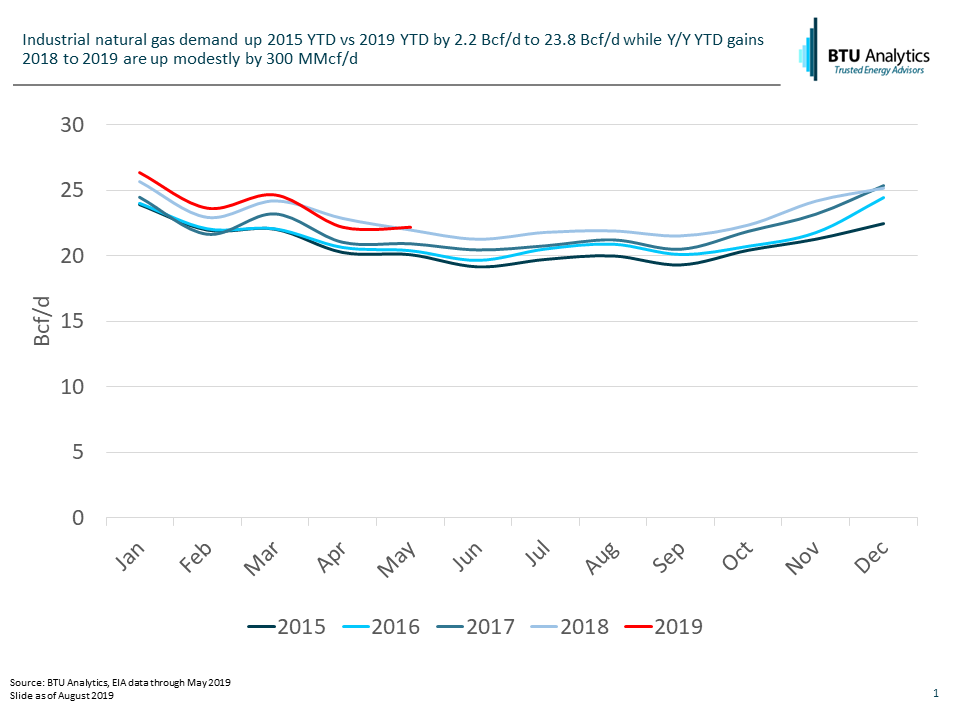
As shown below, industrial gas demand is up 2.2 Bcf/d YTD 2019 versus 2015 as new industrial facilities have come into service. Each year since 2015, has shown steady increases higher as the ‘shale gas story’ has driven investment in the US industrial base.
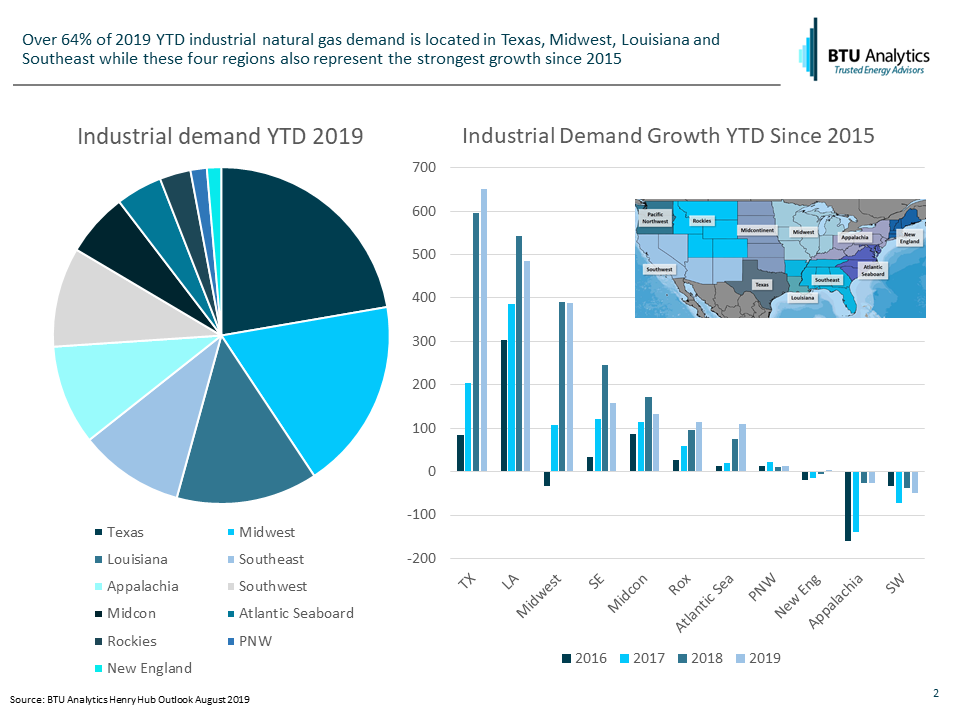
The majority of US industrial demand is located in Texas, the Midwest, Louisiana, and the Southeast as shown below. In addition, these four regions also represent the fastest growing regions for industrial demand. Existing industrial sites, favorable regulatory frameworks, and proximity to low cost shale gas provided tailwinds for investments in these regions.
One of the challenges in analyzing US industrial demand is the dispersed nature of facilities and industries contributing to demand growth. In addition, the lack of transparency into the sector via daily pipeline data is limited to only interstate pipelines. Texas and Louisiana have many intrastate pipelines which also serve the large industrial demand base in these two states resulting in this demand falling outside of daily pipeline scrape analysis. The result is the daily interstate pipeline sample for industrial demand in 2019 shows 6.5 Bcf/d of demand compared to the monthly EIA data at 23.8 Bcf/d as shown below. The pipeline sample does show a positive growth trend moving from an average of 5.3 Bcf/d 2014 to 2016 compared to an average of 6.6 Bcf/d in 2019 YTD.
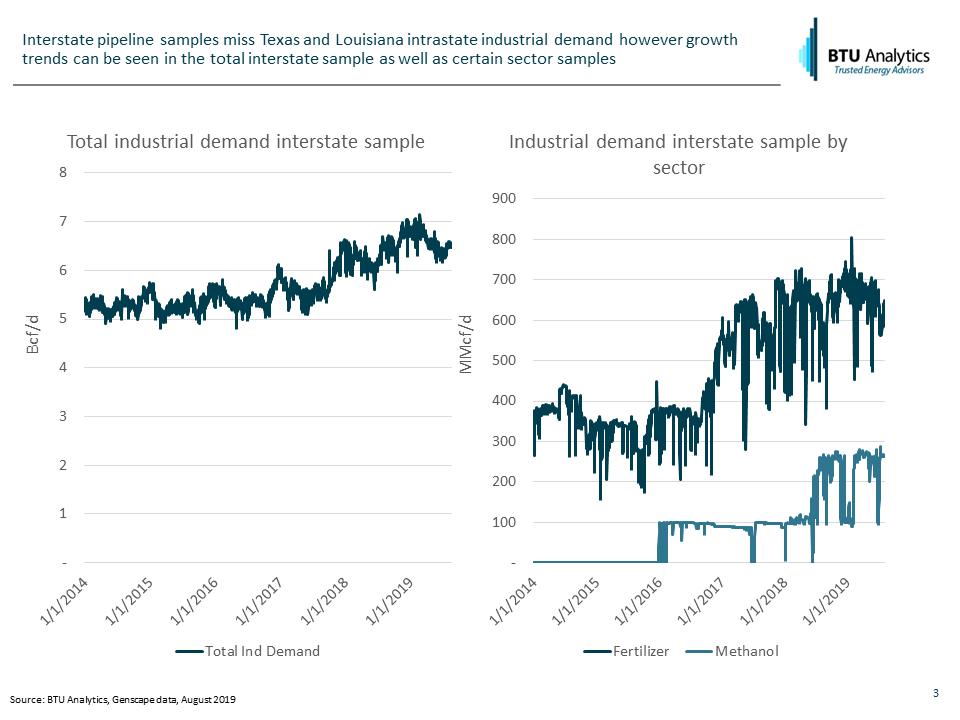
Looking at specific industrial demand sectors within the interstate pipeline sample, the two sectors with the highest growth were fertilizer plants and methanol plants. With both sectors, new facilities with interconnects to interstate pipelines have driven the growth. For the methanol sector, the Methanex Geismar facility in Ascension parish Louisiana and OCI’s Natgasoline LLC plant in Jefferson county Texas represent the entire increase. Meanwhile, the ramp higher in fertilizer demand was the result of two new plants in Iowa. CF Industries Port Neal plant in Woodbury county Iowa and OCI’s Iowa Fertilizer plant in Lee county Iowa both started service in early 2017. Other sectors such as aluminum or steel may have grown during this same time period but the lack of transparency on intrastate pipelines hides this growth from daily pipeline analysis.
Looking forward, there are still some methanol and fertilizer projects moving through the permitting process albeit at different stages. In addition, the further expansion of the US petchem business will continue with many eyes on the Shell Ethane Cracker in Pennsylvania, in the heart of the Marcellus. This cracker and others are likely to drive a slow but steady increase in US industrial demand. To follow BTU Analytics’ coverage of industrial demand, subscribe to the Henry Hub Outlook to access a regional 5-year monthly forecast of industrial demand.