US LNG exports have provided critical relief to an oversupplied US natural gas market. With the first round of LNG operators and their offtakers having captured almost all the open capacity on existing pipelines, how will Wave 2 facilities be able to compete? Why will Appalachia and the Rockies be left behind? Where will supply come from and why will Appalachian, Rockies, and Canadian producers again be left high and dry? Tune in to tomorrow’s Getting to the Gulf – Can We Supply Wave 2 LNG webinar, where we will discuss emerging bottlenecks and investment opportunities which are driven by the concentrated demand footprint for LNG in the Gulf Coast.
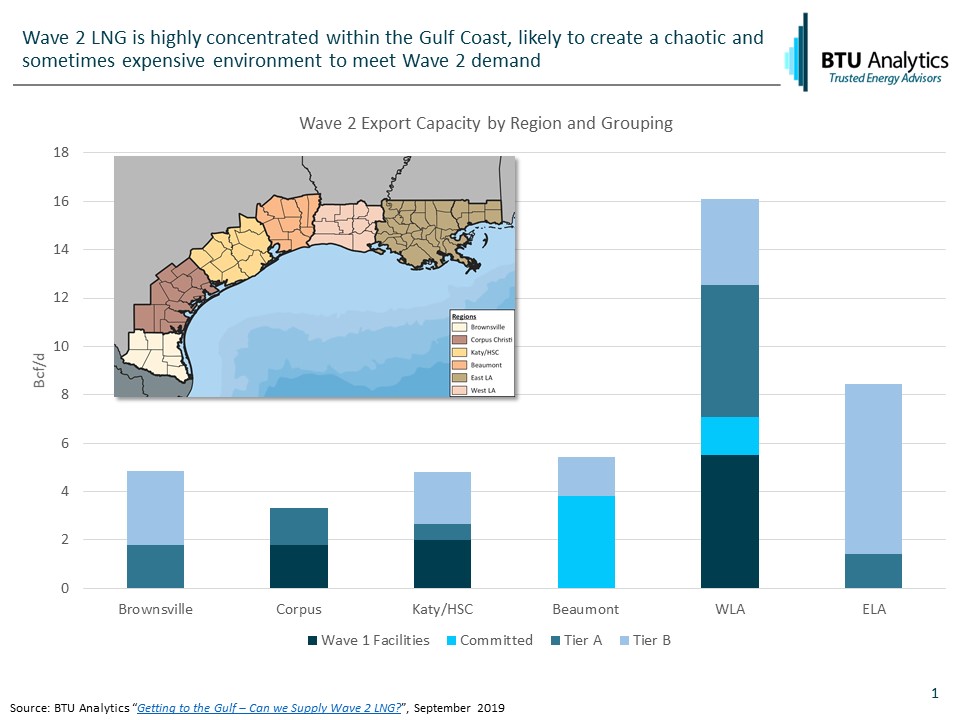
As part of this webinar, BTU Analytics will discuss the categorization and geography of the 35 Bcf/d of proposed Wave 2 facilities into four categories: “Committed”, “Tier A”, “Tier B”, and “Unlikely Projects”. The capacity and geographical location of Wave 2 facilities by these categorizations is depicted in the chart below.
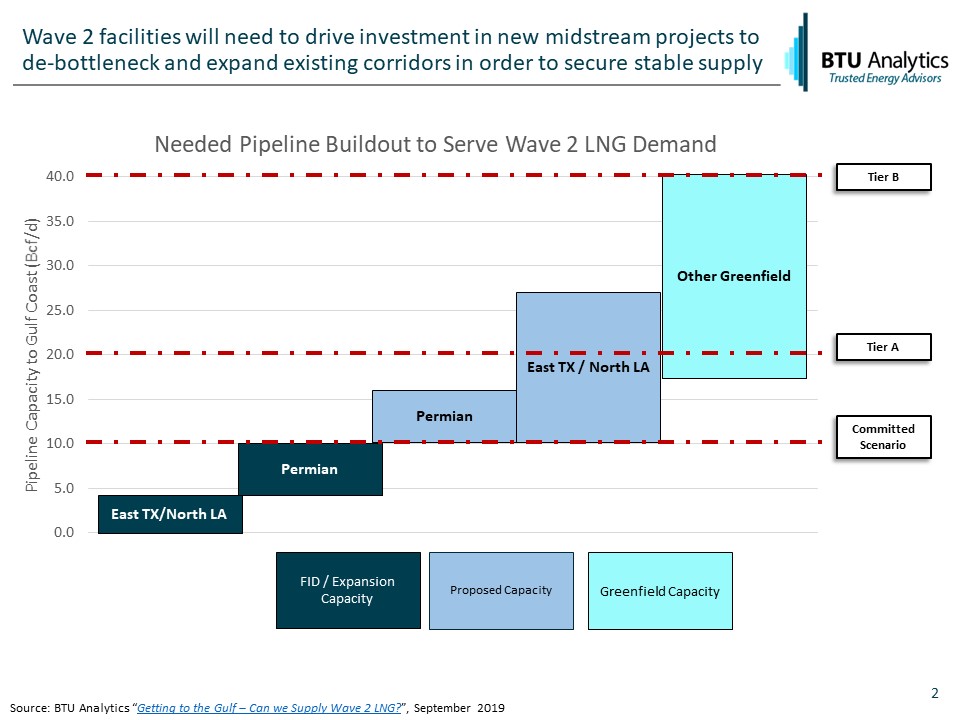
Furthermore, as predicted in our previous energy market commentary Congestion Ahead for Haynesville Producers?, pipeline congestion connecting Northern Louisiana/East Texas with the Gulf has already arrived and Wave 2 LNG facilities will only magnify this under every potential scenario.
The Getting to the Gulf study highlights why infrastructure will likely determine the winners and losers of the US LNG export push, how much infrastructure will be needed and where, and which upstream assets will miss the proverbial boat, again. Request more information on BTU Analytics’ in-depth study on how pipeline development is the hidden risk no one wants to discuss when talking about US LNG Wave 2 exports.