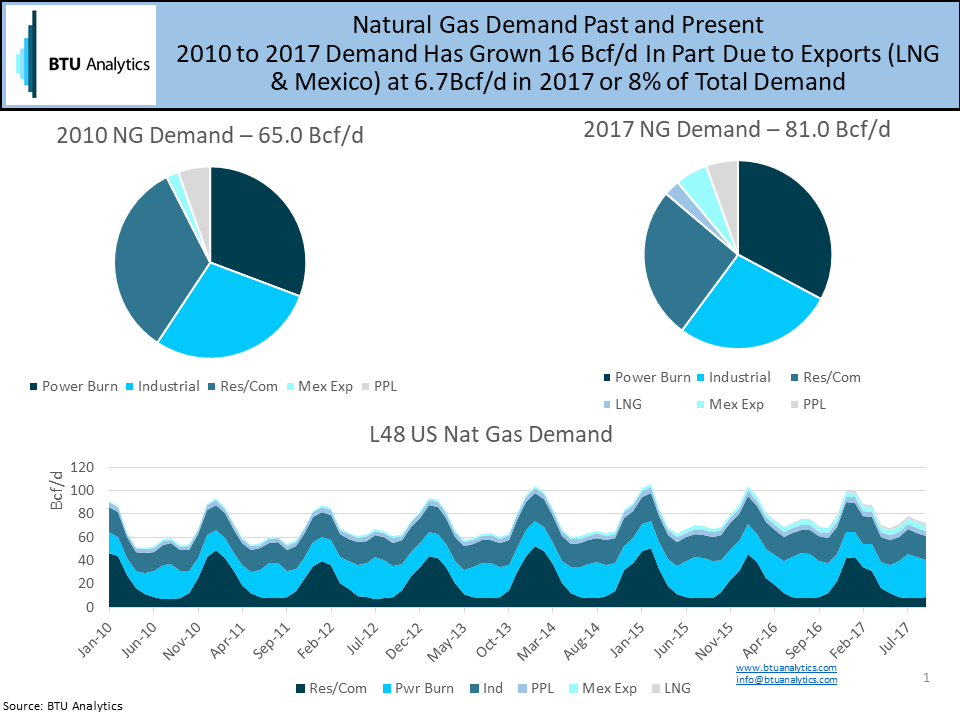
As U.S. gas-focused E&Ps have become more efficient, they have also needed new markets for the gas they produce. And the good news for those producers is that natural gas demand in the U.S. has grown from 65 Bcf/d to 81 Bcf/d from 2011 to 2017 as shown below. The largest gains are from LNG export and Mexican exports. These new export demand components represent almost 7 Bcf/d or 8% of U.S. demand in 2017. Meanwhile, the typical domestic natural gas demand components (power burn, res/com and industrial) continue to grow, albeit at much lower growth levels.
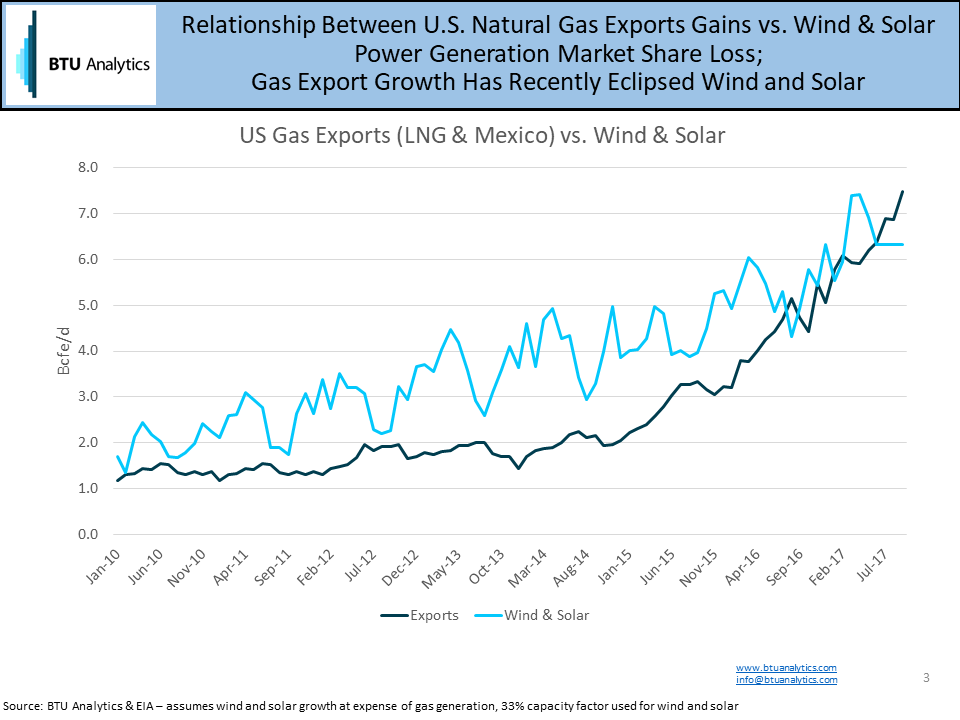
Exports are setting up to be the new relief valve for the U.S. gas market, supplementing the role power burn has played in recent years. Despite significant coal retirements, finding material natural gas power burn growth has been challenging considering the erosion effect of gas-on-gas competition from new large combined cycles in addition to the impact of wind and solar. The question that this commentary will examine is how has gas export growth compared to gas generation market share loss to wind and solar. Is it true – Is renewables pain offsetting gas export gains?
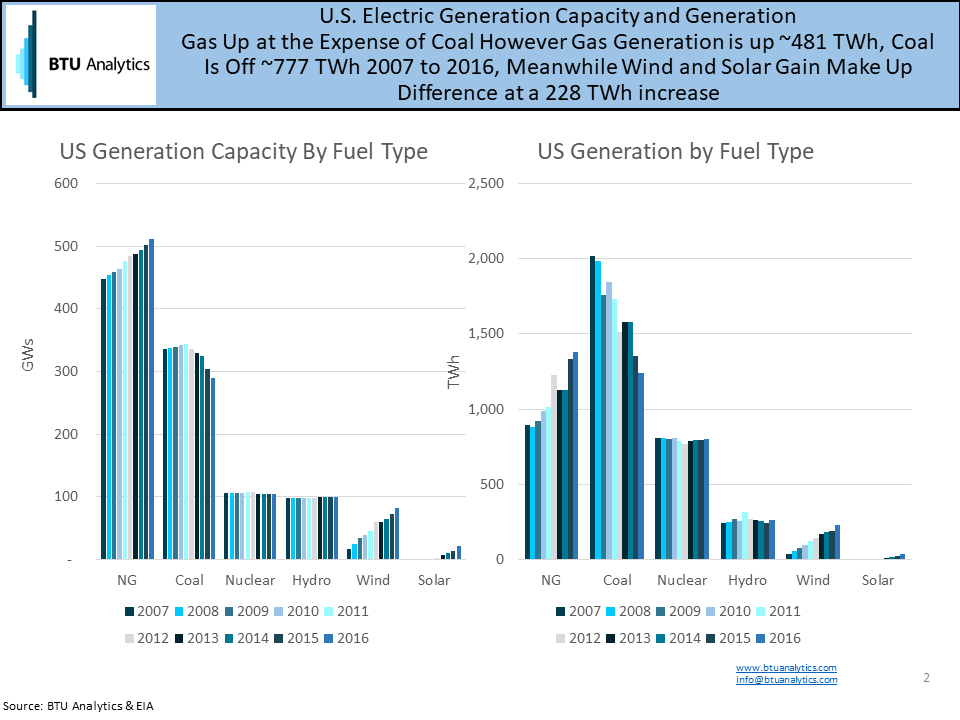
If we look at EIA generation capacity and generation by fuel type data from 2007 to 2016, some interesting trends emerge. First, we can see the impact of low natural gas prices driving both gas capacity and total annual generation higher over the time period. Meanwhile, coal capacity and generation have trailed off in recent years due to in part the Clean Power Plan as well as low cost natural gas. Nuclear and hydro capacity and generation have remained flat. Wind and solar have shown consistent gains year-over-year, over the period. Looking at generation, we can see gas is up ~481 TWhs, but utility-scale wind and solar is up to 228 TWhs while coal is off 777 TWhs from 2007 to 2016. The takeaway – gas power burn has grown but wind and solar are taking significant generation market share that might otherwise have been for natural gas.
On that point, if we convert the wind and solar generation growth to a Bcfe/d metric (assuming a 33% capacity factor for wind and solar and an equivalent 7,500 heat rate) we can see renewables are eroding as much as 7 Bcf/d of market share from natural gas in summer 2017 – exactly the same level of gas exports in 2017. The good news is that recent export growth, driven partially by a fourth train at Sabine Pass coming online this fall, has eclipsed renewables in recent weeks. The question remains, with another 7 Bcf/d of LNG export capacity set to come online in the next 3 years and an additional 5 Bcf/d of Mexico export capacity coming, will gas export growth outpace the impact of renewables growth in coming years?