


As natural gas prices rally and oil prices take a new dip, developing a deeper understanding of E&P well economics continues to be of paramount concern. Today, we will take a snippet out of our new E&P Positioning Report and analyze Marcellus Economics.
First, BTU Analytics will provide an overview of our methodology utilized in the Eagle Ford, Bakken, Haynesville, Permian, Barnett, Cotton Valley, DJ (Niobrara), and PRB. Second, we will review key inputs into estimating well by well returns and the impact to overall producer economics. Finally, BTU Analytics will rank producers’ Marcellus economic results against each other to determine which producers have been the best operators.
Marcellus Economics Methodology
In order to estimate Marcellus economics, we collect a host of assumptions on costs including gathering fees, severance taxes, royalty rates, and well costs. For well costs, BTU Analytics developed a standardized methodology for estimating drilling and completion costs on a well by well basis utilizing a combination of lateral length, drilling depth, proppant volumes, and other factors derived completion reports. This model for well costs is then combined with state reported well production data to estimate the prices necessary to generate an economic return at a 10% discount rate under various realized prices of natural gas and oil.
Modeling well costs on a well by well basis is critical to understanding operator economics due to the wide variation in drilling and completion designs used through time and across operators. For example, the chart below highlights BTU Analytics estimated lateral lengths for all 1,826 wells turned to sales since 2013 in Northeast Pennsylvania.
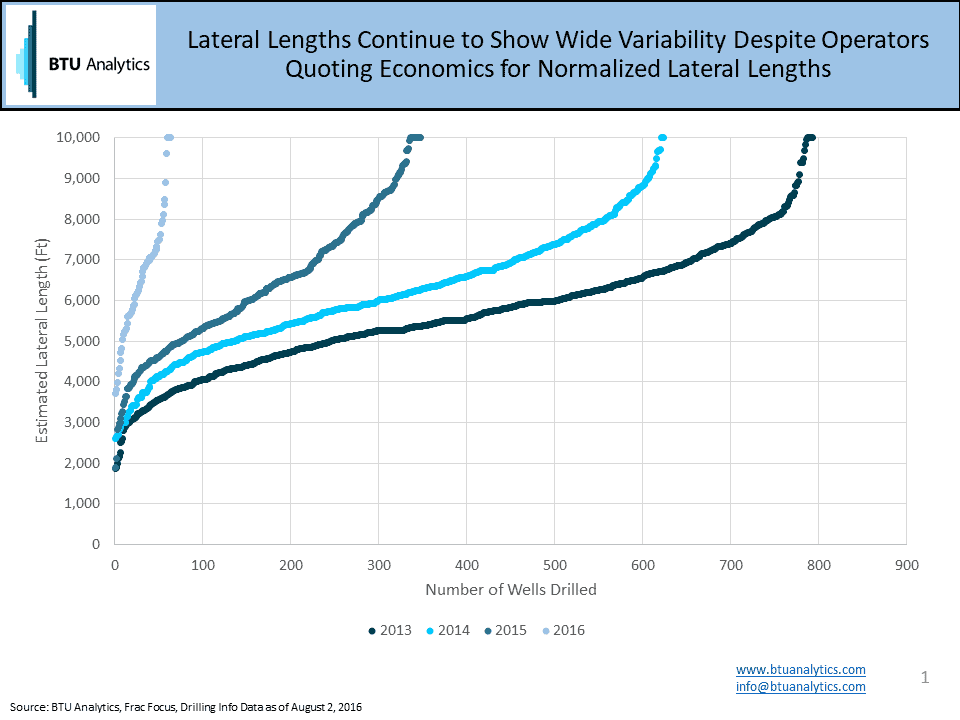
The average lateral length continues to increase year over year. In 2013, 793 wells turned to sales had an average lateral length of 5,681 feet and the 347 wells in 2015 averaged over 6,400 feet. In addition to controlling for lateral length, BTU Analytics drilling and completion estimates control for well depth, proppant volumes, operator, and year. The resulting outcomes of this model show that by our estimate the average well in 2013 cost $9.5M with Range Resources (NYSE: RRC) drilling some of the lowest cost wells due to shorter laterals while some operators in deeper portions of the play drilled wells at an average cost over $12M. Comparatively, well costs declined on average to $6.3M in 2015 with the range of operator costs between $5.5M and $8.1M.
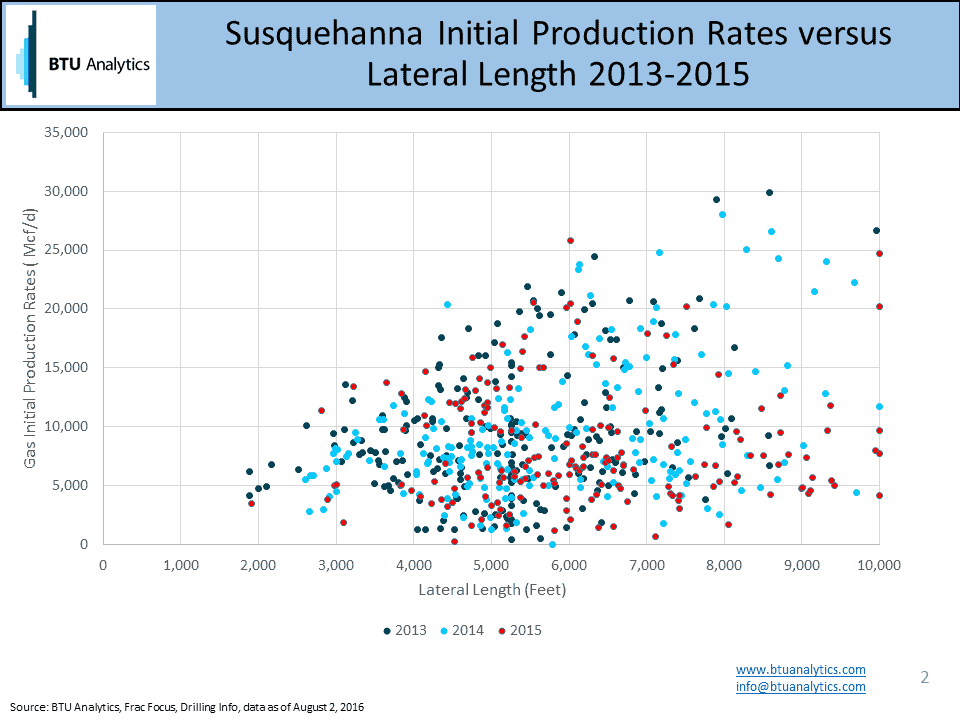
The wide variability in completion designs, lateral lengths, and proppant volumes combined with rock quality yield equal variation of distribution of initial production rates. The below chart shows the correlation of lateral lengths to estimated initial production rates for wells in Susquehanna, Pennsylvania.
Now that we have reviewed two of the key inputs into modeling well by well Marcellus Economics, lets take a look at the outcomes. Not surprisingly Cabot (NYSE: COG) had the best results in 2015 with 55% of wells drilled having an estimated economic break-even below $2.00/MMbtu and an average economic breakeven of $1.97/MMbtu as of July 2016.
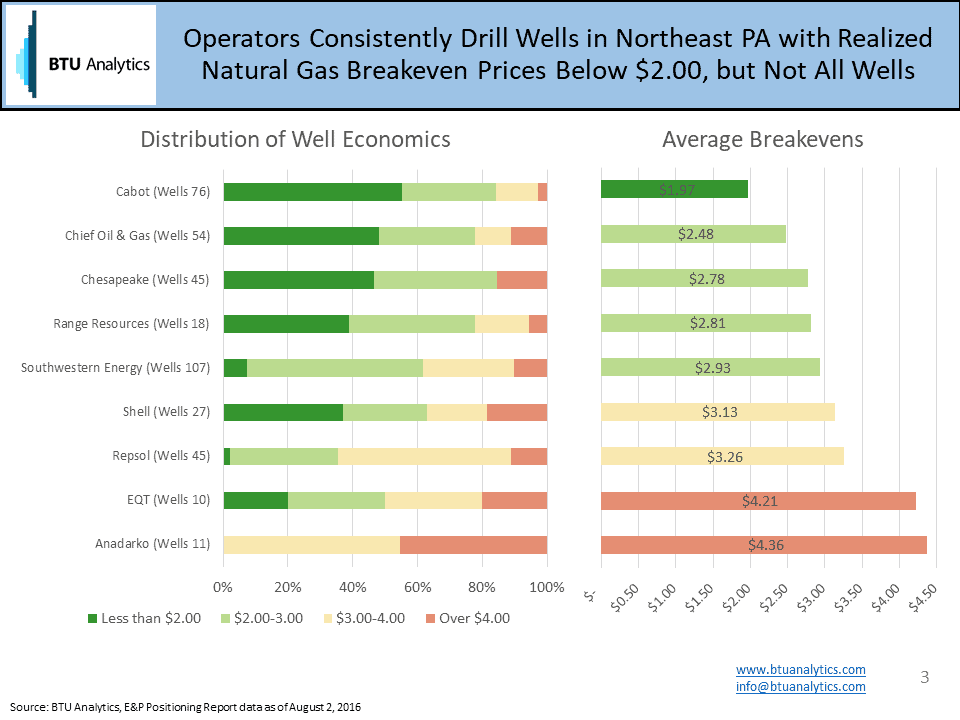
Private operator Chief O&G was the second best operator in 2015 drilling 54 wells with an average breakeven just below $2.50 while Chesapeake (NYSE: CHK), Range Resources(NYSE: RRC), Southwestern Energy (NYSE: SWN) ranked third to fifth developing Marcellus acreage for $2.75-3.00/MMbtu. Not all acreage and operators are created equal though. Due to combination of factors from acreage location to market access results for EQT (NYSE: EQT) and Anadarko Petroleum (NYSE: APC) have not fared as well.
Last week, BTU Analytics outlined 5 key questions to understand E&P positioning.
- Which operators leased the best acreage?
- Which operators produce at the lowest cost?
- Which producer has the greatest growth potential?
- Can E&P’s access markets capable of absorbing the supply?
- What commitments may constrain or enable upstream investments?
Today, we’ve provided a snippet of the economic ranking for Marcellus producers. It was not a surprise that Cabot was the best in the region, but as we analyze the results in our new E&P positioning report would you expect that 5 operators had better results in 2015 than Pioneer (NYSE: PXD) or that the lowest cost oil producer in the country is located primarily in the Delaware basin?
Stay tuned to BTU Analytics commentary for analysis on producer growth potential next week.


