Managing a company in the E&P industry has changed substantially over the course of the shale revolution. The relationship between revenue and costs has not always mattered. However, over the past several years, the industry has found (or been coerced into) cost discipline. With investors expecting returns, it is worth checking in on the industry’s ability to produce profitably at different price levels. Today’s Energy Market Insight uses the BTU Economics View platform to shine a light on improvements natural gas producers have made over time.
Natural gas is produced in every basin across the country, most often as a byproduct in the hunt for crude oil. It is targeted in only a few areas, with the majority of horizontal activity focused in Appalachia and the Haynesville shale of East Texas and Northern Louisiana. The chart below highlights the pace of horizontal wells turned to sales by quarter over the past six years.

Appalachian activity has accounted for the bulk of activity through time. However, productivity and cost improvements in the Haynesville coupled with better access to Gulf markets have helped drive activity in the Haynesville higher. Now, Haynesville activity represents approximately 20-30% of the combined wells to sales in 2020 and 2019.
While the economics of these regions are often touted by producers, actual results vary considerably. Overall producer economics depends not on the individual wells called out in press releases but on the aggregated results of the development program. The chart below shows the distribution of economic results for the same group of horizontal wells. Note that the 2020 Q3 data is still somewhat incomplete due to the lag on production history to estimate well economics.
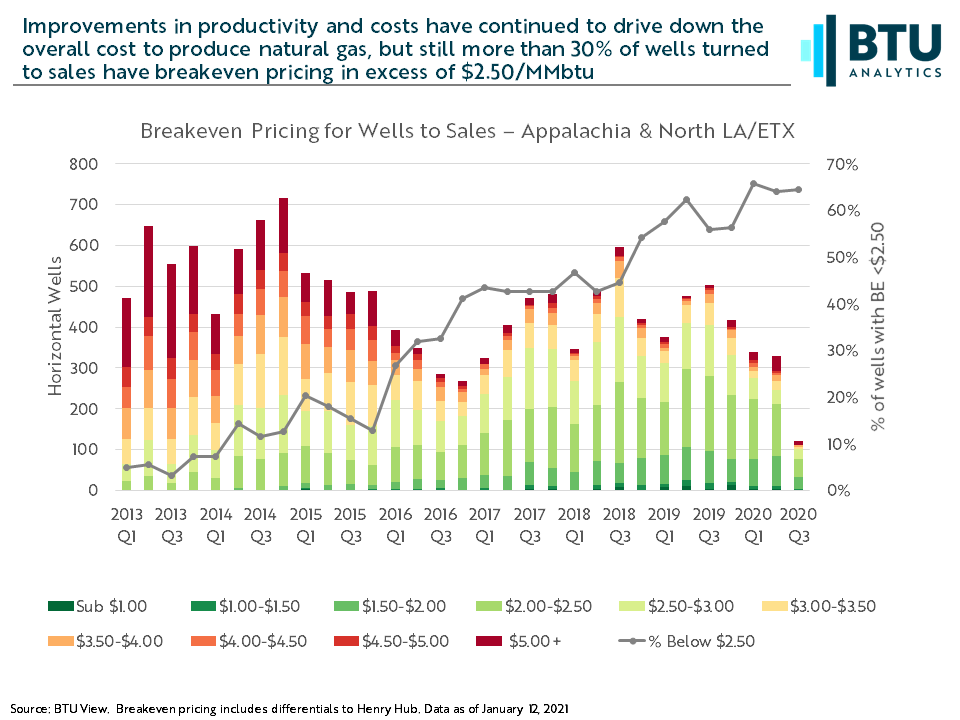
A number of observations can be gleaned from the chart. First, given that Henry Hub pricing was below $2.00/MMbtu for a substantial portion of 2020, the fact that the percentage of wells with breakeven pricing under $2.00/MMbtu is still below 10% in recent quarters doesn’t bode well for the industry as a whole. However, the green segments of the distributions continue to climb through the chart, indicating that more than 50% of wells had breakeven pricing below $2.50/MMbtu for much of 2019 and 2020. This indicates that more recent pricing is much closer to providing returns to natural gas drillers before taking into account corporate costs and the impacts of hedging.
How do these results skew by operator? How could liquids pricing change this dynamic? How much of these trends are driven by productivity versus cost containment? Request a trial of the BTU View to give your team access to the tools and data powering BTU’s market analysis.