Natural gas producers have been lucky over the last two years as two back-to-back colder-than-normal winters have spiked demand to record levels, depleted storage and driven prices higher making room for year-over-year supply gains. As we roll into the peak of the summer, market participants are keeping a close eye on the weather forecast, EIA storage levels, gas-fired power burn, coal-to-gas switching and natural gas production levels. With lots of chatter about El Nino in 2015 creating a cooler wet summer, if this plays out, the onus of the power burn vs. gas production levels balance could be sliding to the side of US natural gas producers.
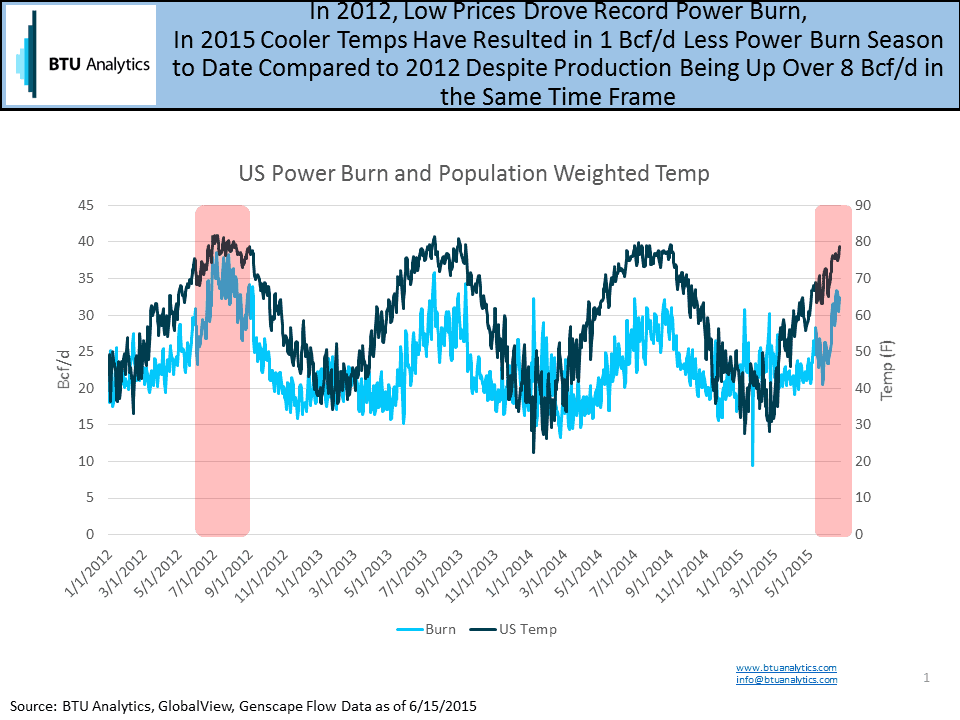
Let’s face it, the 10-day weather forecast for New York City looks pleasant with highs in the 70’s and low 80’s degrees F. This is great for a walk in Central Park but horrible for power burn and by extension US natural gas producers. If we have a cooler-than-normal summer, the gas market loses the balancing option of increased power burn driven by lower natural gas prices and coal-to-gas switching. The next obvious option is lower production levels to balance the market which producers would prefer not to consider. Note US dry natural gas production rose 4.4 Bcf/d 2011 to 2012, 1.5 Bcf/d 2012-2013 and 3.5 Bcf/d 2013 to 2014 according to BTU Analytics’ Upstream Outlook.
When we compare 2012, a record year for natural-gas fired power burn, to 2015 we can see power burn in 2015 is 1.0 Bcf/d lower due to lower season-to-date temperatures despite the fact that production is 8.0 Bcf/d higher over the same time frame.
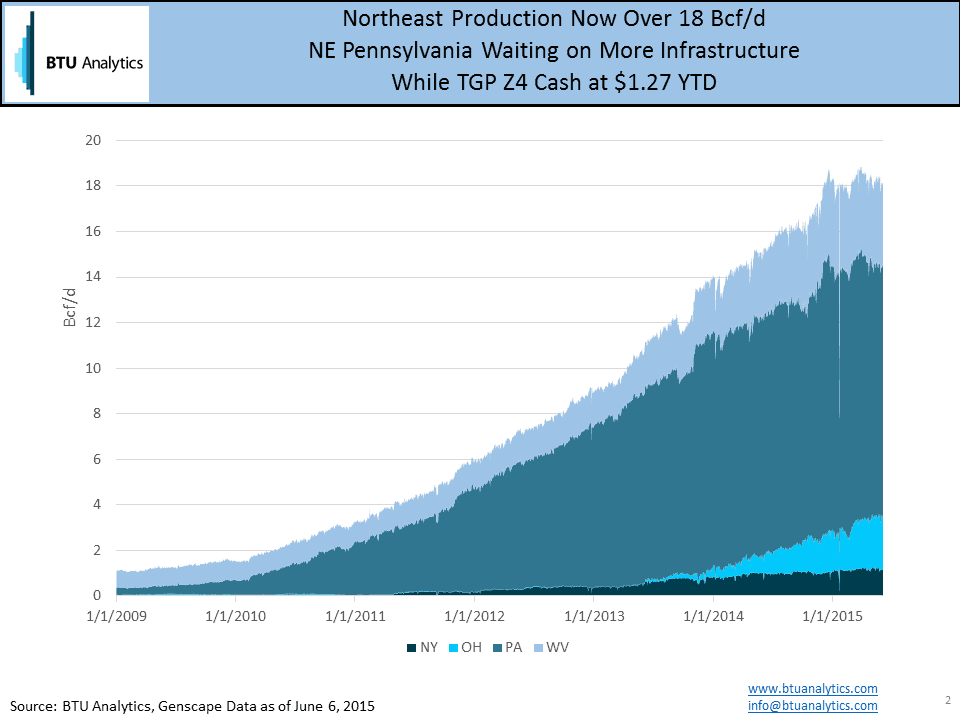
If we look at Northeast production, we do see the impact of low prices and constrained pipes as production seems to have plateaued at around 18 Bcf/d in 2015 as producers have cut rigs but also in some cases curtailed production to wait for a better pricing environment.
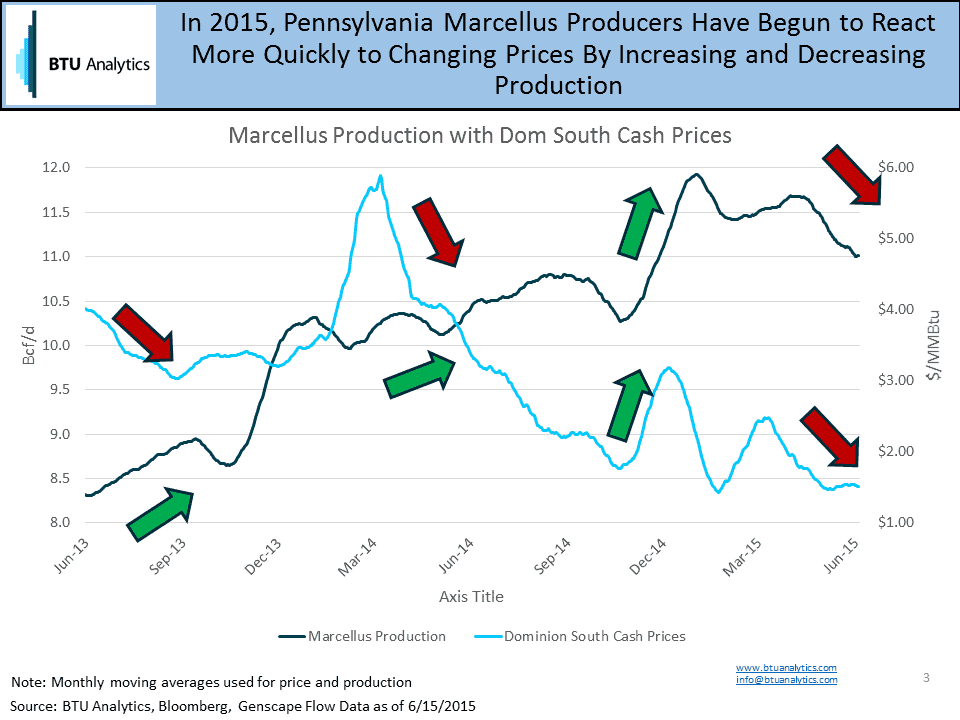
It also would appear that Northeast producers are fine tuning their operations based on well-head realized pricing. The chart below shows Pennsylvania gas production vs. Dominion South cash prices. In 2013 through Q2 2014, production grew despite fluctuations of cash prices around $3 to $6. Notice however, Q3 2014 through present shows as cash prices have plummeted below $3, production is now more sensitive to price and climbs when prices move higher and declines as prices decline. This illustrates that at lower price levels, as you would expect, producers are more sensitive to price.
BTU Analytics forecasts storage will get to the 3.9 Tcf level by the end of the 2015 injection season as the inter-play of production, power burn and price will get us there. If a big slug of above-normal heat does not show up in the next 8 weeks, expect to see weak natural gas prices force producers to balance the market this summer by further reducing activity and announcing additional production curtailments.