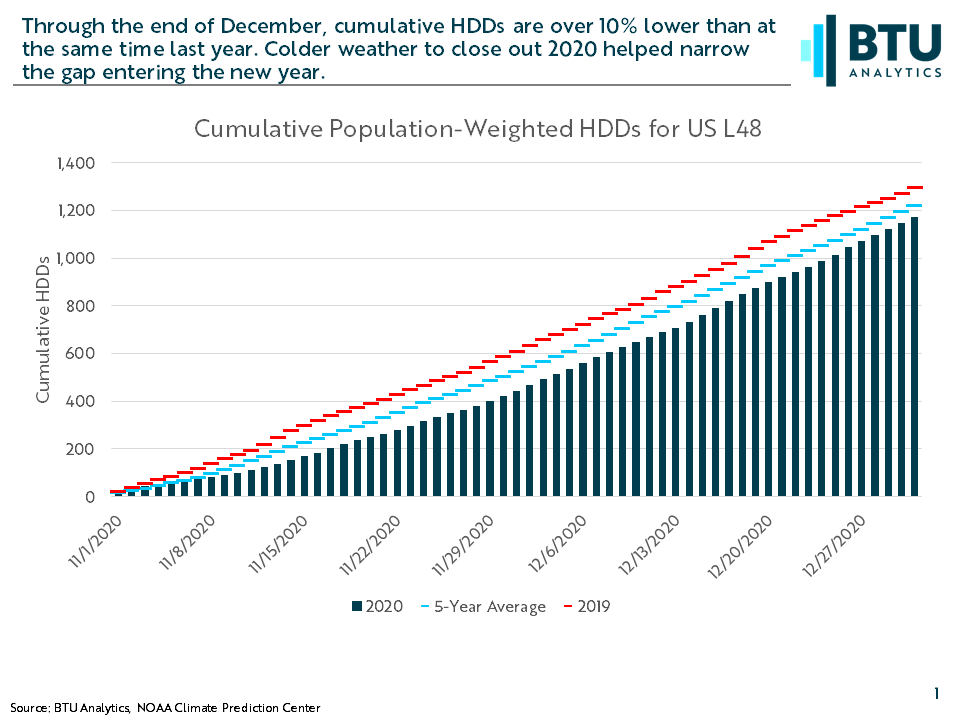
Despite a recent snap of colder weather to close out 2020, winter thus far has been exceptionally warm placing downward pressure on natural gas prices. Through the end of December, cumulative population-weighted heating degree days (HDDs) are over 10% lower than at the same point last year. While November and December are not necessarily indicative of the rest of the winter (see winter ‘19/’20), the remainder of the season will need to see significantly colder temperatures to make up the deficit. However, in addition to mild winter temperatures, residential and commercial heating demand is also underperforming thus far in 2020 compared to prior years, even at similar temperatures.
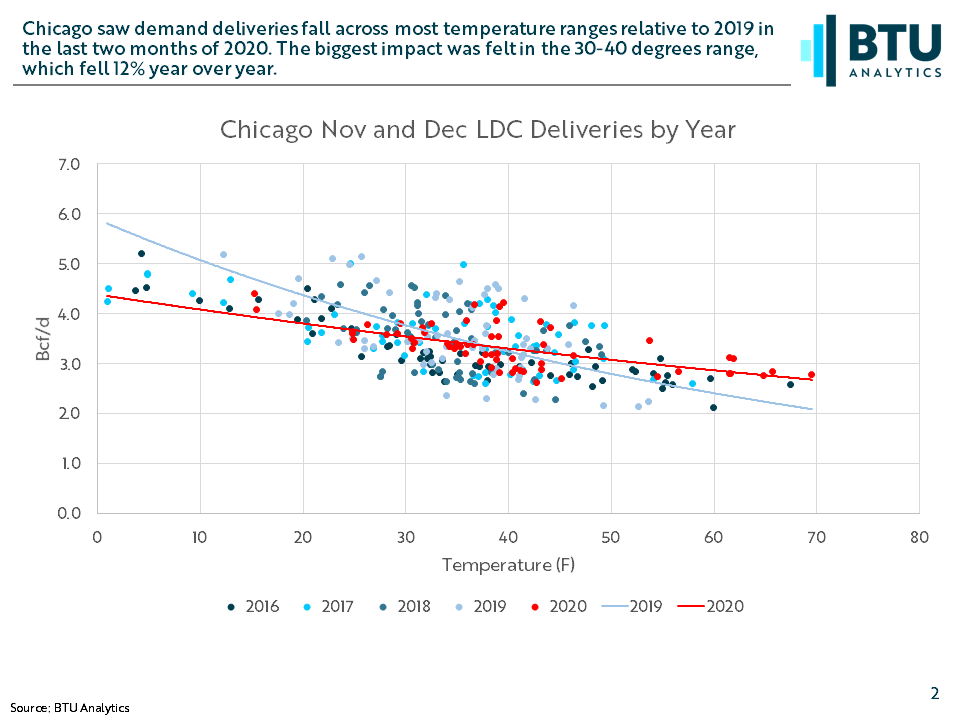
An examination of daily demand in two major US cities, Chicago and Boston, provides an illustration of this trend. In Chicago, average daily demand has fallen year over year across most temperature bands, generally reverting to 2018 levels of demand after years of growth. Between 30 and 40 degrees, the most common temperature band for the city, demand has fallen by 4% YoY, a decline of over 125 MMcf/d. A similar decline occurred between 10 and 20 degrees and 40 and 50 degrees with declines of 166 MMcf/d and 113 MMcf/d, respectively. The largest impact occurred between 20 and 30 degrees with demand averaging 492 MMcf/d lower than 2019.
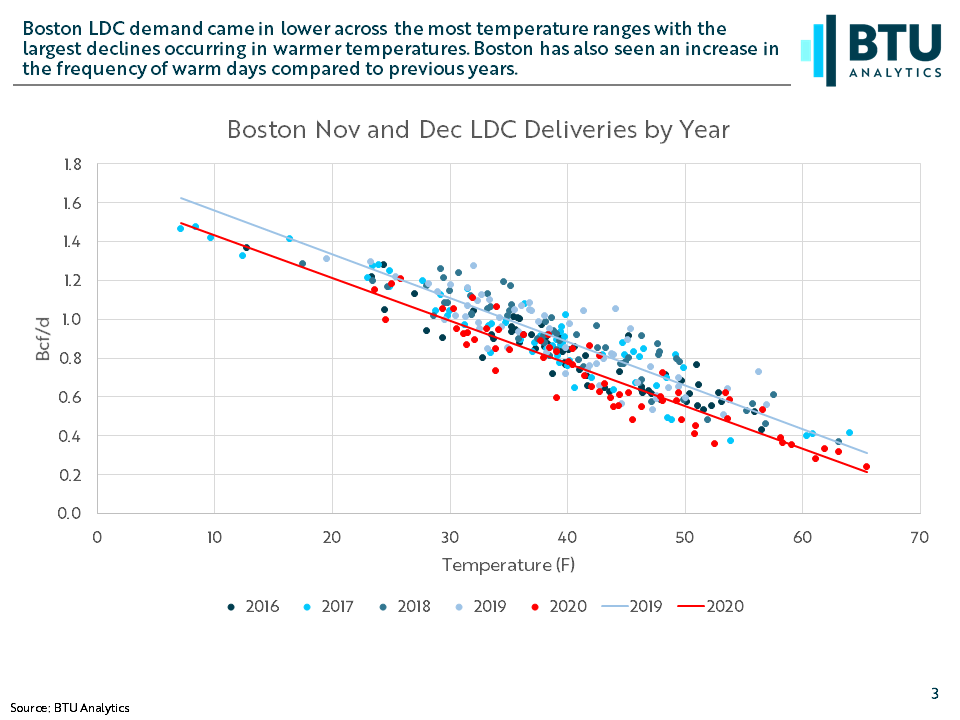
While Chicago demand was muted evenly across the board, Boston saw greater demand losses at increased temperatures. Between 30 and 40 degrees, again the most common temperature range for the city, daily demand averaged 106 MMcf/d below 2019 levels, an 11% decline. Between 40 and 50 degrees, that decline increased to 14%. Between 50 and 60 degrees, the decline increased all the way to 25%, 152 MMcf/d lower on average than in 2019. Not only did demand perform worse at warmer temperatures. Boston saw an increase in the frequency of higher temperatures. From 2017 to 2019, Boston averaged only 5 days in November and December with temperatures above 50 degrees. In 2020, Boston saw 14 such days, one fewer than the last three years combined.
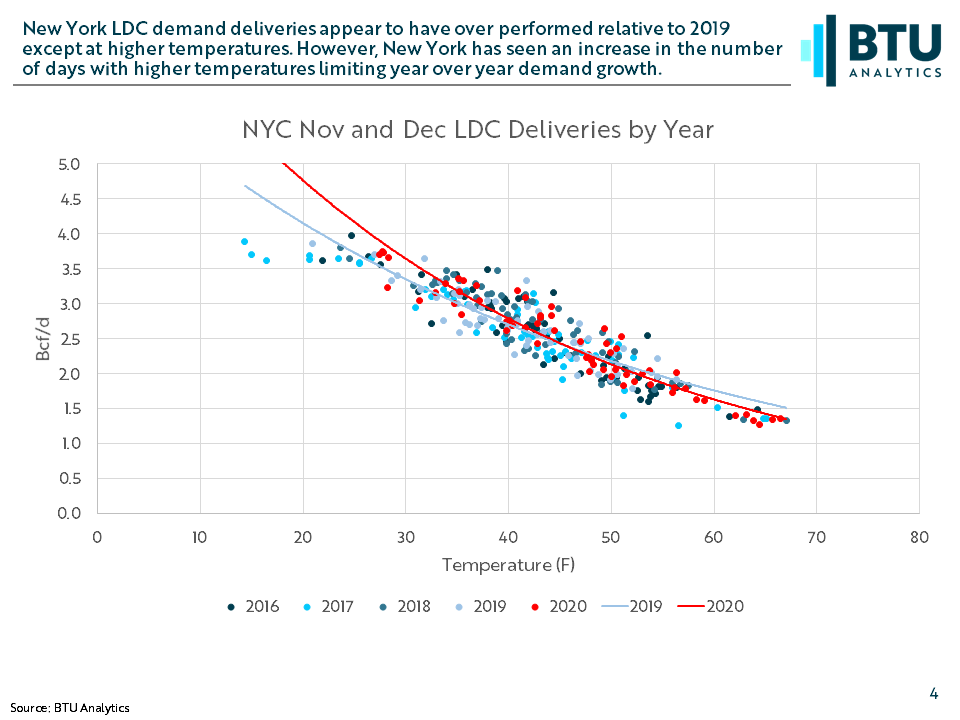
One city that appears to buck this trend is New York which has seen demand increase compared to 2019. Between 30 and 40 degrees, average daily demand grew by 126 MMcf/d, a 4% increase. New York also saw a 3% increase in demand for temperatures between 40 and 50 degrees. These increases are likely due to a higher population density compared to the other two cities as well as the potential for fuel oil switching which is not as prevalent in other regions. However, above 50 degrees, demand decreased by approximately 6%. Like Boston, demand underperformance at higher temperatures was accompanied by an increase in the number of warmer days with New York experiencing 22 days above 60 degrees compared to an average of 11 days in the last three years.
These declines are likely a result of the economic impacts of the COVID-19 pandemic. While the pandemic has forced more people to stay home, potentially increasing residential heating demand, it has also forced businesses and restaurants to close leading to declines in commercial demand. Should mild temperatures persist through the remainder of winter, a continuing trend of underperformance in residential and commercial heating demand could spell trouble for the US gas market in 2021. BTU Analytics tracks US heating demand and its impact on gas storage and pricing in our monthly Henry Hub Outlook report.