


The future of Canadian natural gas got a little brighter earlier this week when LNG Canada announced a positive FID. The LNG export terminal on the west coast of British Columbia, which we discussed in Canada LNG: AECO, Rockies in the Black with Kitimat? in July, will have an initial capacity of approximately 14 million tonnes per annum, or about 1.8 Bcf/d, and is expected to be completed and shipping gas by the middle of the next decade. For context, average dry gas production in western Canada in 2018 is 16.2 Bcf/d. While this facility gives Canada access to growing demand in Asia, it will likely impact natural gas dynamics in the US if Canadian natural gas is diverted to LNG Canada instead of the US markets it currently serves.
To understand the possible future impacts of LNG Canada on the US, we need to understand the current dynamics of Canadian natural gas entering the US. While there are many pipelines along the US/Canada border moving natural gas in both directions, there are six main pipelines that carry natural gas produced in western Canada into the US, shown below. Average flows on these pipes into the US so far this year have been approximately 8 Bcf/d.
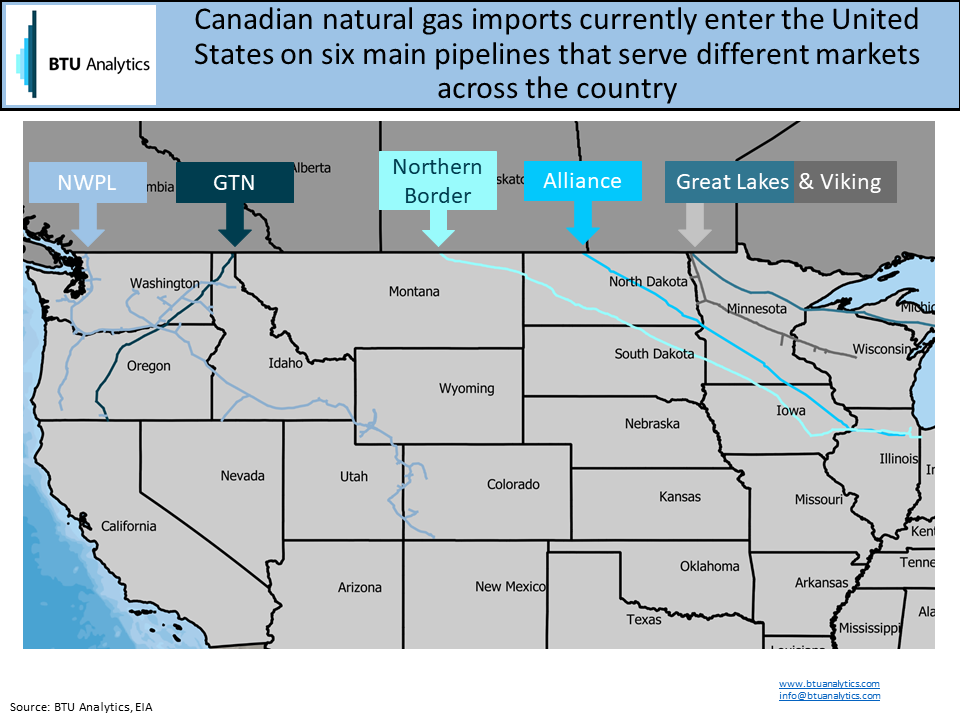
Imports of Canadian gas into the US on these pipelines were decreasing in the first few years of this decade but have since rebounded and are nearly back to the levels seen in 2010. Each of the pipelines entering the US shows different trends in flows over the years, as they all have different dynamics and serve different markets. To know how further changes to Canadian gas imports might affect US markets, we need to look at each of these pipelines individually. This Energy Market Commentary will take a closer look at the GTN system. It is important to note that pipeline dynamics can be complex, and this analysis only scratches the surface.

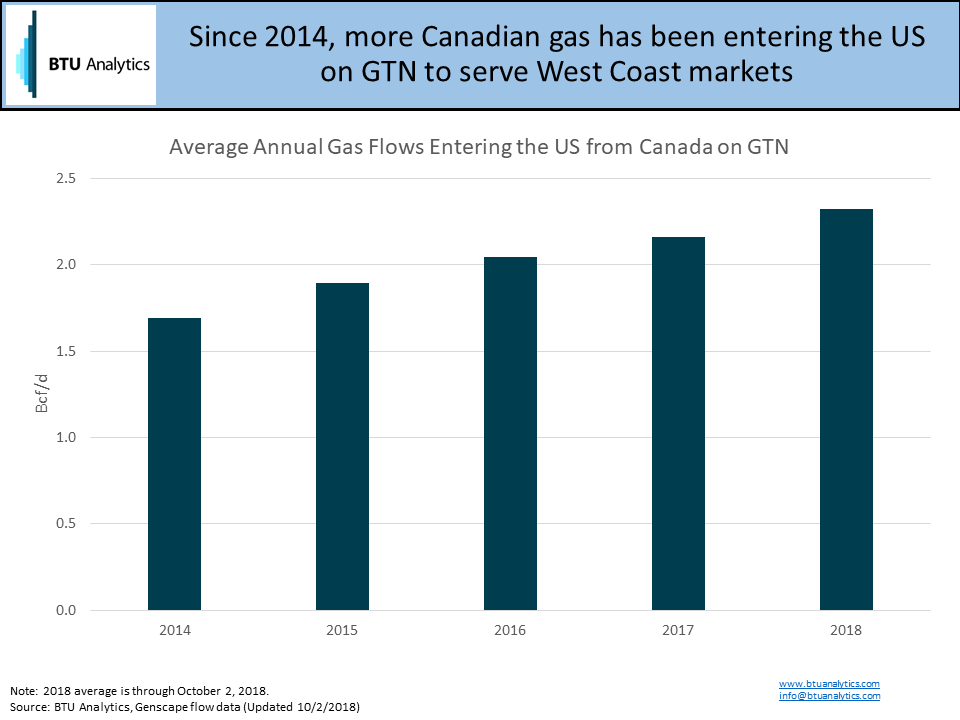
Over the past few years, the amount of Canadian gas entering the US on GTN has been increasing, which is not the case for all these pipelines even as total imports have increased since 2015. Since 2014, GTN flows at the US/Canada border have increased over 0.6 Bcf/d on average from about 1.7 Bcf/d. Once the gas enters the US, most of it is transferred to other pipelines, namely the PG&E Redwood Pipeline and Northwest Pipeline, to serve demand downstream. More than half of the gas on GTN moves to PG&E Redwood to serve demand in California.
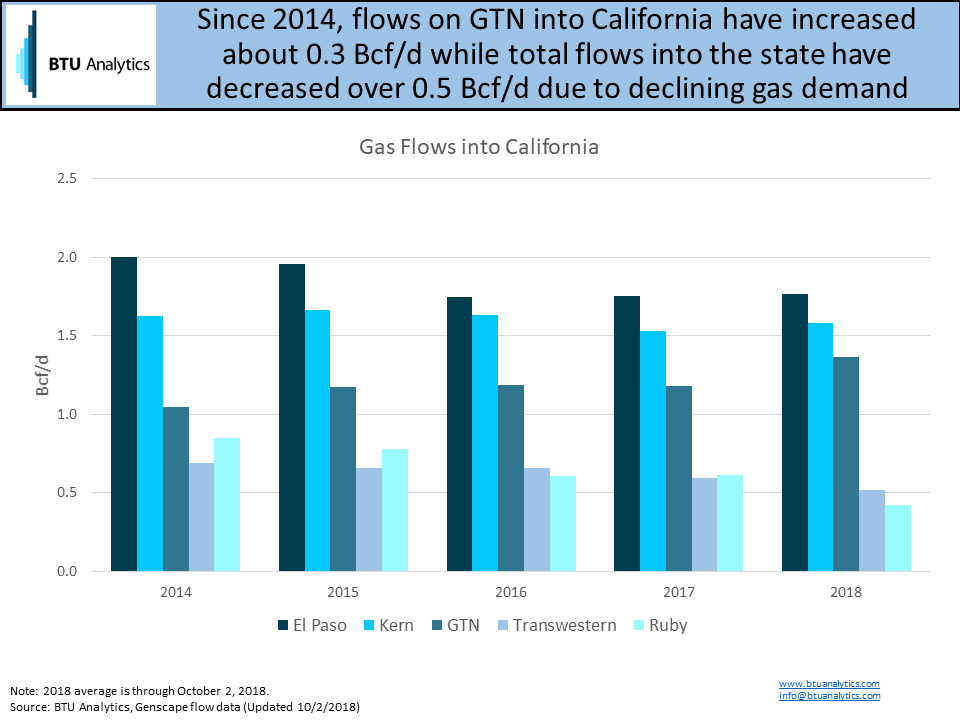
Supply dynamics in California have been changing in recent years. While Canadian imports have increased at the same time Rockies production has been declining. The effects of these changes can be seen in the chart below. Flows on GTN into California have increased with the increasing Canadian imports, while overall California demand has been decreasing in recent years. Flows on some other pipelines into California, namely El Paso, Ruby, and Transwestern, have decreased in part because of this lower demand and increased competition with Canadian gas.
When LNG Canada comes online early next decade, will flows on GTN stay high to serve markets like California, or will Canadian natural gas be redirected to serve growing Asian markets? Will Canadian natural gas production grow enough to serve both markets, or will producers have to decide between the two, potentially forcing US markets to find supply from elsewhere? How will these changes affect the future of Rockies gas? For more on BTU Analytics’ view on North American natural gas markets, request samples of our Henry Hub Outlook, Northeast Gas Outlook which covers basis markets, and Long Term Gas Outlook reports.


