Pipeline takeaway out of the Northeast has been the key focus of producers and investors in US natural gas assets over the past decade. While several major pipeline projects are expected over the next two years, the end of the buildout is appearing on the horizon. And as Marcellus and Utica’s production continues to grow, a new concern is coming to the forefront —sweet spot exhaustion. Astute listeners may have heard Range Resources CEO Jeff Ventura mention the topic on the company’s year-end 2017 conference call on February 28, 2018. While no one doubts that the Appalachian Basin contains world-class resources and enormous amounts of gas-in place, not all of this resource can be developed at $3.00/MMbtu gas. Today let’s explore the size of the region’s sweet spots and just how quickly they may be drilled through.
The map below shows BTU Analytics’ economic analysis of wellhead breakevens aggregated into 3×3 mile boxes across Southwest Appalachia. Let’s keep the focus on SW Appalachia in this commentary, as infrastructure dynamics will impact inventory drawdown in SW Appalachia and Northeast Appalachia differently.
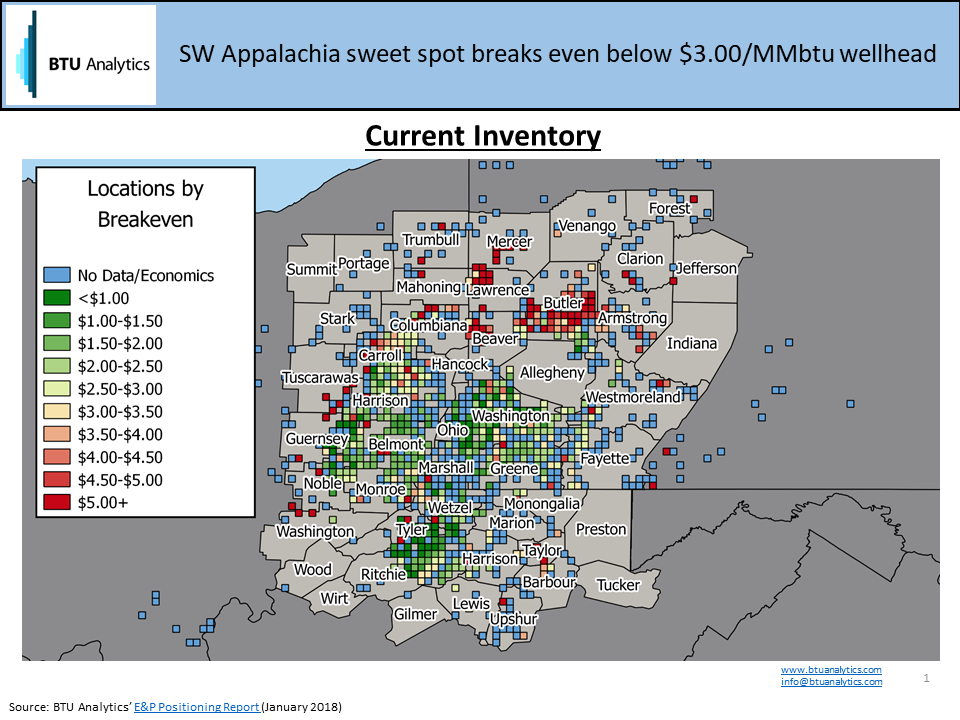
The green boxes highlight acreage with expected breakevens sub $3.00/MMbtu at the wellhead. This analysis is based on results from wells brought to sales from 2014 to present. Note that the blue boxes indicate areas where wells have been drilled but economics are not estimated. These are boxes where wells were either drilled prior for 2014 and not since or where wells have been drilled more recently but well level production isn’t yet available to estimate economics. We don’t draw down locations within these boxes for the purposes of this Energy Market Commentary.
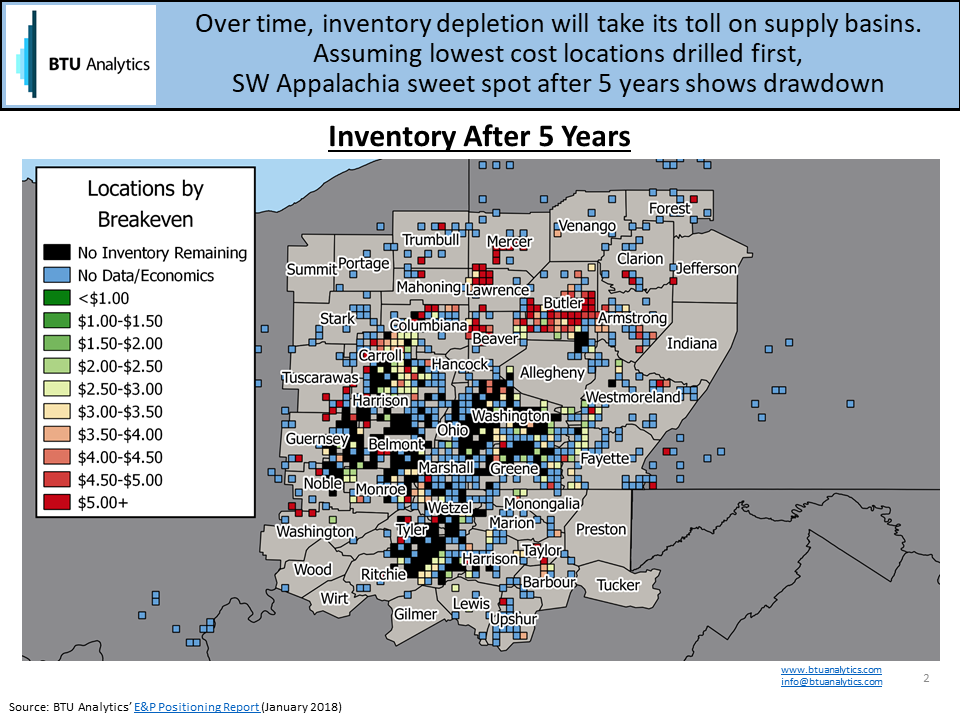
The next map shows how startling the drawdown of inventory in the sweet spots of SW Appalachia could be as we exhaust more than 6,000 locations over the next five years. This illustration assumes that most economic locations are drilled first, and we can see that large portions of Washington, Belmont, and Tyler counties would be drilled out if that were the case.
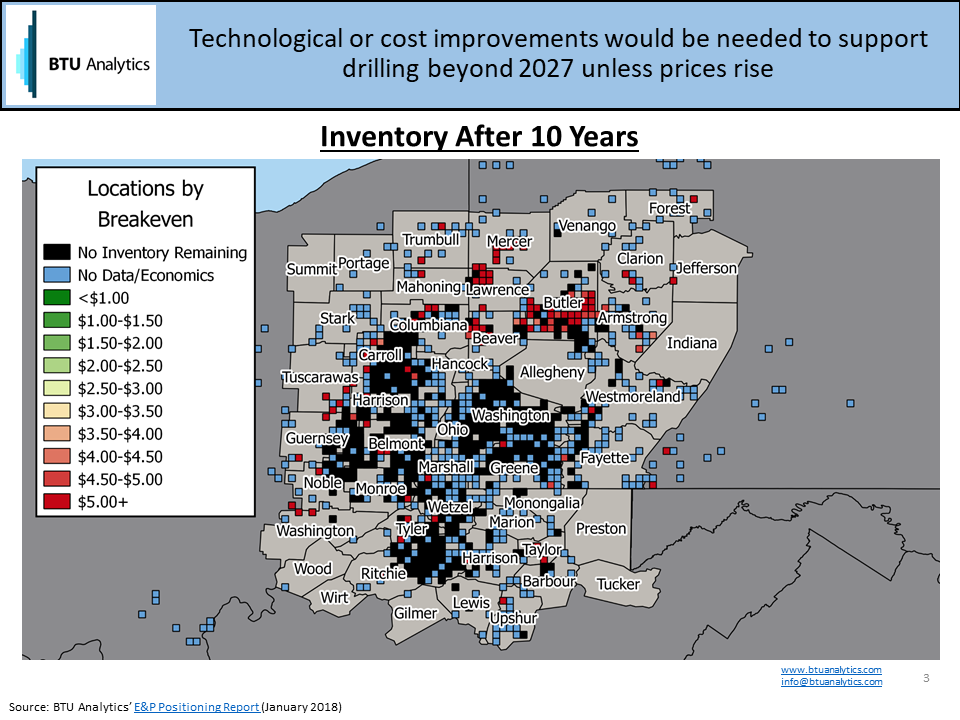
After ten years of drilling, much of Washington County has been consumed and large swaths of Eastern Ohio have also been drilled.
So is this finally the bullish case for natural gas? What does this mean for natural gas pricing? Will Barnett producers finally have a day in the sun?! For more information on our inventory estimates by breakeven across all the major basins, request a sample of our E&P Positioning Report. And sign up to be among the first to see a sample of our Long Term Gas Forecast Product, including 30-year expectations for natural gas fundamentals and price, and our full inventory blowdown by breakeven analysis, launching 2Q 2018.