If you’ve been following the evolution of the Marcellus and Utica you know the seemingly perpetual need for new pipeline takeaway capacity. However, we are entering a special time in the history for the region as the first of a wave of greenfield pipeline projects enters service. This kicks off sweeping changes that will hit the Northeast. However, don’t expect basis relief anytime soon. In our upcoming complimentary webinar, we will tell you what to watch for as we finally receive long-awaited takeaway capacity.
Probably the most relevant place to begin the conversation is with Energy Transfer’s Rover Pipeline. Drama abounded in the first and second quarter of 2017 as to whether the project would receive its FERC Certificate and then whether a tight tree clearing deadline could be met. But with those obstacles surpassed, the project has entered partial service as of September 1. While there have been additional regulatory challenges surrounding the project, we believe the project is on track to add another 2.25 Bcf/d of takeaway by the first quarter of next year.
Previously we discussed how this new capacity has impacted flow dynamics, but Rover is not the only pipeline project to serve the Northeast. Not only are there additional brownfield pipes coming online this year, but five more major greenfield projects are on their way. As you can see in the map below, in Western Appalachia (i.e. Dominion South pricing) there is still plenty of capacity coming after Rover, with another 7.5 Bcf/d of capacity coming online for a total of 10.7 Bcf/d of new incremental capacity out of the area.
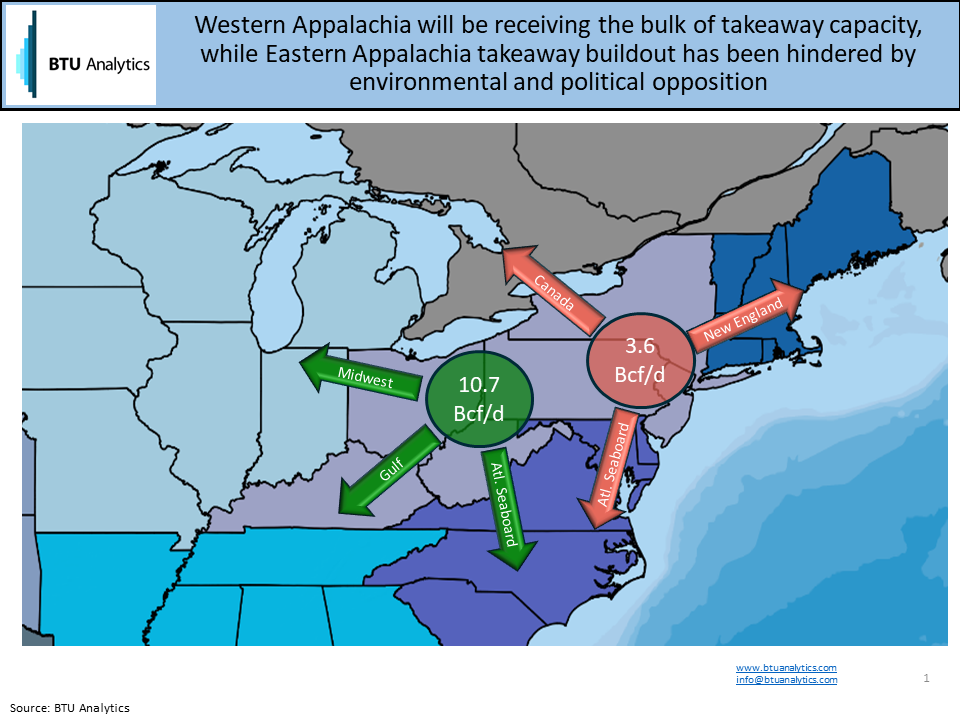
Contrast that with what Eastern Appalachia (i.e. TGP Z4/Leidy pricing), where we are only expecting an additional 3.6 Bcf/d of new takeaway out of an area with some of the best rock in the country. This discrepancy in new capacities sets us up for a shift in pricing dynamics within the Northeast between Dominion South and TGP Zone 4 pricing.
However, taking new capacity at face value is not enough. We need to dig deeper and figure out where that capacity will deliver molecules to, and if that end market is a growing, viable market for new production. For example, which corridors do we expect to be highly utilized: Appalachia to the Atlantic Seaboard or Appalachia to the Midwest?
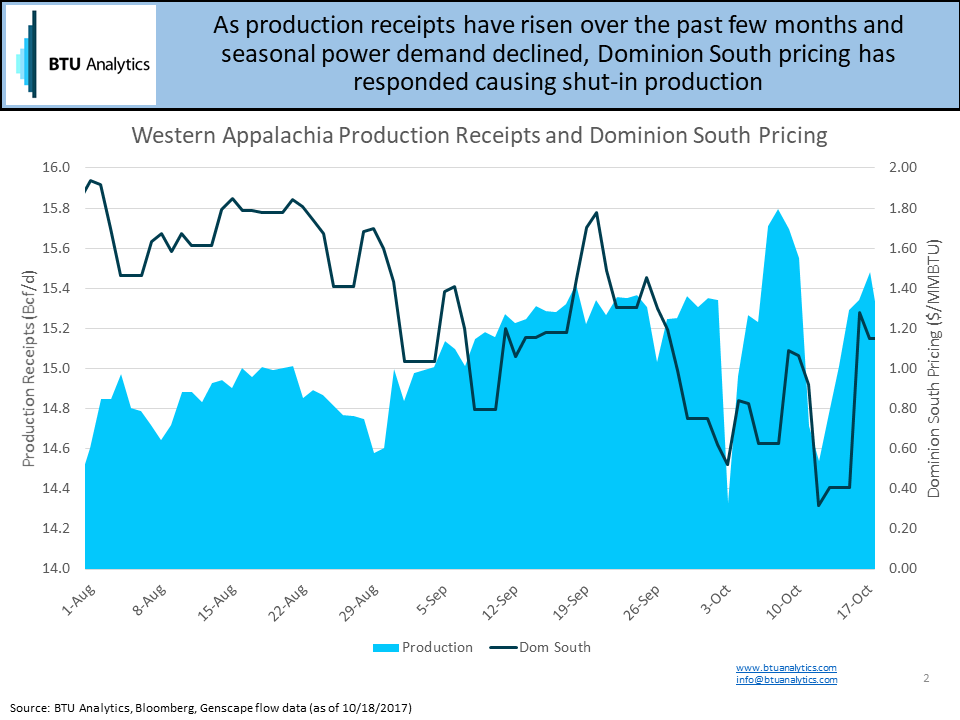
Obviously, pricing will play a pivotal role in answering this question and anyone watching pricing over the last few months has seen Dominion South crater. The culprits behind this price weakness are ebbing regional demand as summer cooling demand has declined and increasing production receipts pushing the region closer and closer to capacity, as the graphic below shows.
Will Rover or this year’s takeaway projects help uplift weak prices in the Northeast? We don’t think so. To find out why we don’t expect to see basis relief in the Northeast until 2020, sign up for our free webinar where we will not only answer the above, but take your questions as well.
To sign up for this complimentary webinar, click here, complete the required info, then on Thursday November 2nd at 3:00 PM EST, log in and learn what happens next in the Northeast. All registrants will receive a copy of the presentation and a free sample of BTU’s Northeast Gas Outlook.