


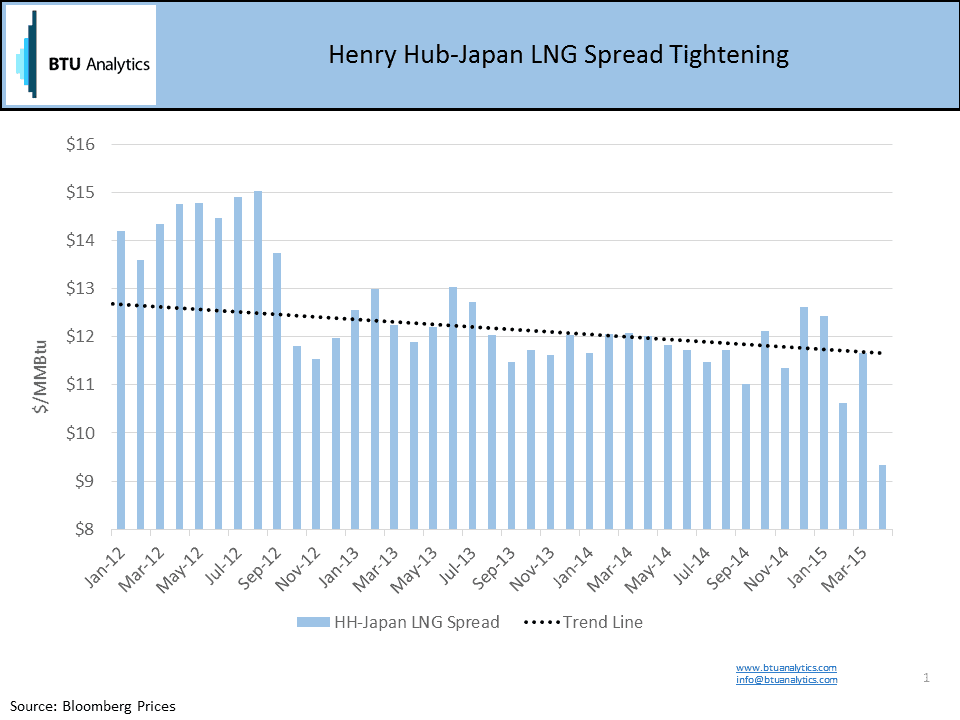
Natural gas production efficiencies and cheap, abundant shale gas have driven the U.S. natural gas market into a multi-year oversupplied situation, everyone knows this. As producers have pushed the limits to find new markets in North America, this search is expanding to the global natural gas market with over 20 proposed North American LNG export projects chasing the highest global market and using Japan LNG as reference, prices have averaged over $13/MMBtu 2015 YTD. What does this mean to future global natural gas spreads? As we all know, markets tend to overshoot. The 2000-2005 US LNG regasification build out, driven by North American natural gas production declines, is one such example. The shale gas driven infrastructure build of 2007-2010 is another. As Mark Twain once said, “history does not repeat itself, but it does rhyme”.
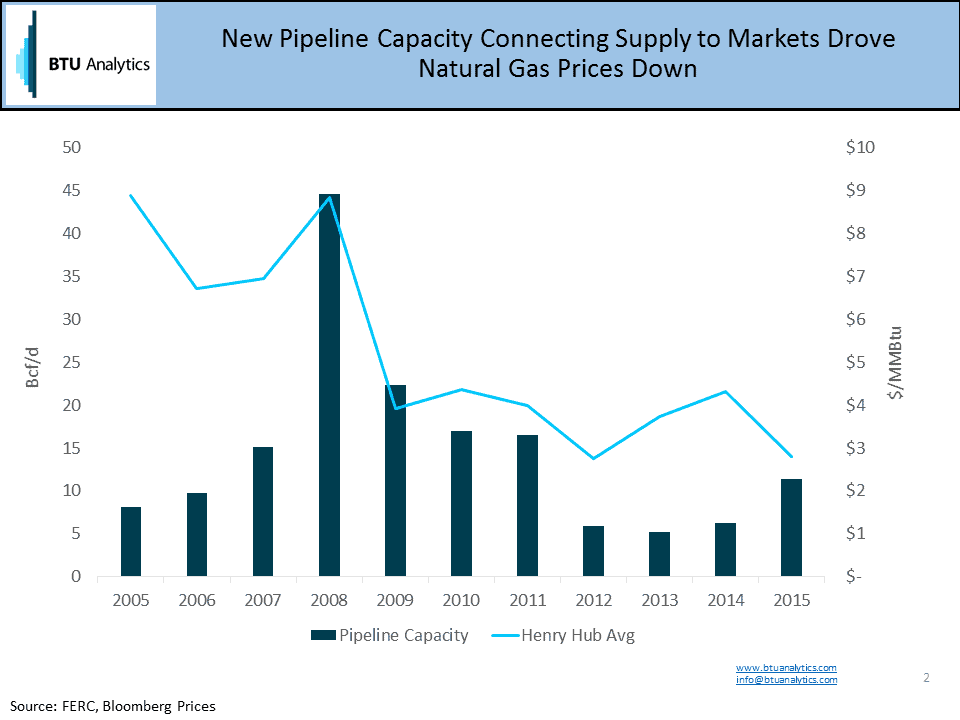
In the span of 2000 to 2008, natural gas prices were pushed from the $2/MMBtu range to an average of $9/MMBtu in 2009 driven by strong demand growth, declining production and supply uncertainty related to hurricanes. The market response to higher prices was cracking the shale gas code accompanied by a massive amount of pipelines and storage projects that were proposed and built peaking in 2008 at over 40 Bcf/d of new pipeline capacity. In 2009, as production grew and with the support of new pipeline infrastructure, Henry Hub prices fell by almost $5/MMBtu or 56% year over year.
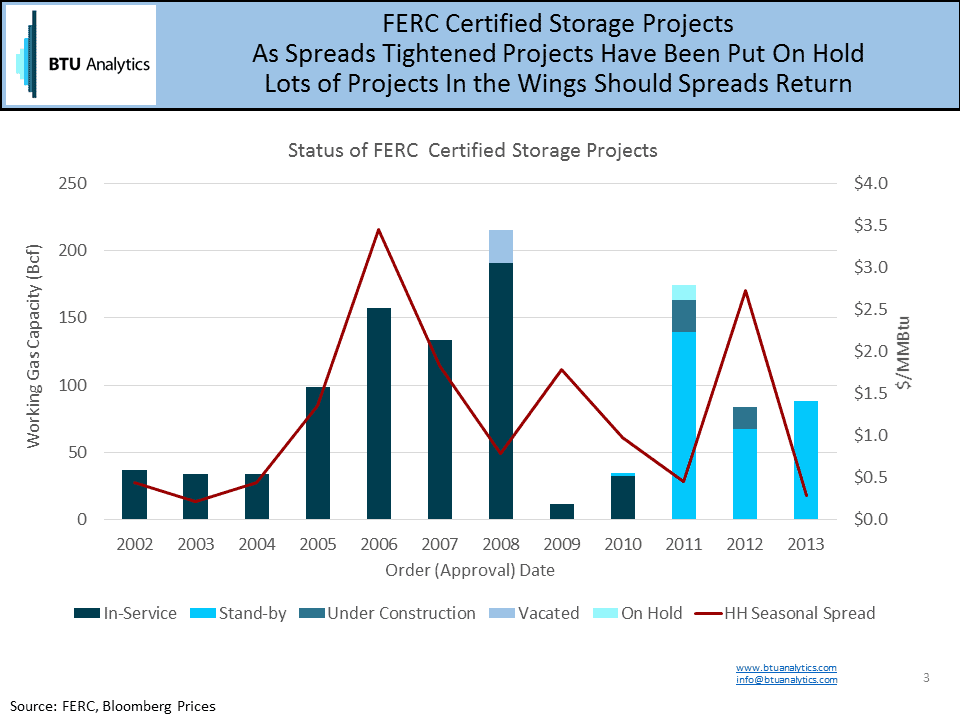
A similar scenario occurred with natural gas storage infrastructure developments and seasonal spreads as shown in the chart below. Seasonal spreads peaked in 2006 while storage development peaked in 2008. As spreads collapsed, storage projects have been put on hold or cancelled. Should spreads return, many projects are in the wings and ready to come online.
From a global view, China, India and the Middle Eastern countries are the countries with projected increases in liquid fuel consumption while the OECD countries consumption slows down and even drops from current levels. China leads the growth in this group by far. Per EIA, China’s demand is estimated to grow on average 4% per year and consumption will grow as much as 20 millions of barrels per day by 2020 pushing the US to second place in liquid fuel consumption. China currently has 4 operating LNG import facilities, 6 under construction and many more planned. It also has over 1,300 operating LNG fueling stations and, as reference, the US only has 74 stations. China’s natural gas demand, according to the EIA, is approximately 15 Bcf/d and expected to double by 2035 to 32 Bcf/d. This is why China is a global target and, no doubt, one of the justifications for all the LNG export infrastructure development in the U.S.
Back to the original question, when the global LNG market begins to experience US producer push to find new markets, what will happen to global spreads? The entrance of additional lower cost supply to the global supply demand natural gas balance will lead global gas prices to tighten to that incremental supply growth plus variable transport costs.


