


A milder than expected beginning to the fall has seen an increase in US natural gas storage injections, easing fears of a large shortfall relative to normal levels heading into the winter heating season. However, this improving picture becomes more nuanced when the geographical subregions making up this total are examined individually. After enduring numerous challenges resulting in both increased gas demand and lowered gas supply, the West Coast enters winter with storage levels 50 Bcf below the 5-year average, the lowest level seen in at least the last 11 years, leaving it highly vulnerable to blowout pricing in the event of either colder than expected weather or additional supply disruptions. Today’s Energy Market Commentary examines what led to these low storage levels and the pricing implications for Opal this winter.
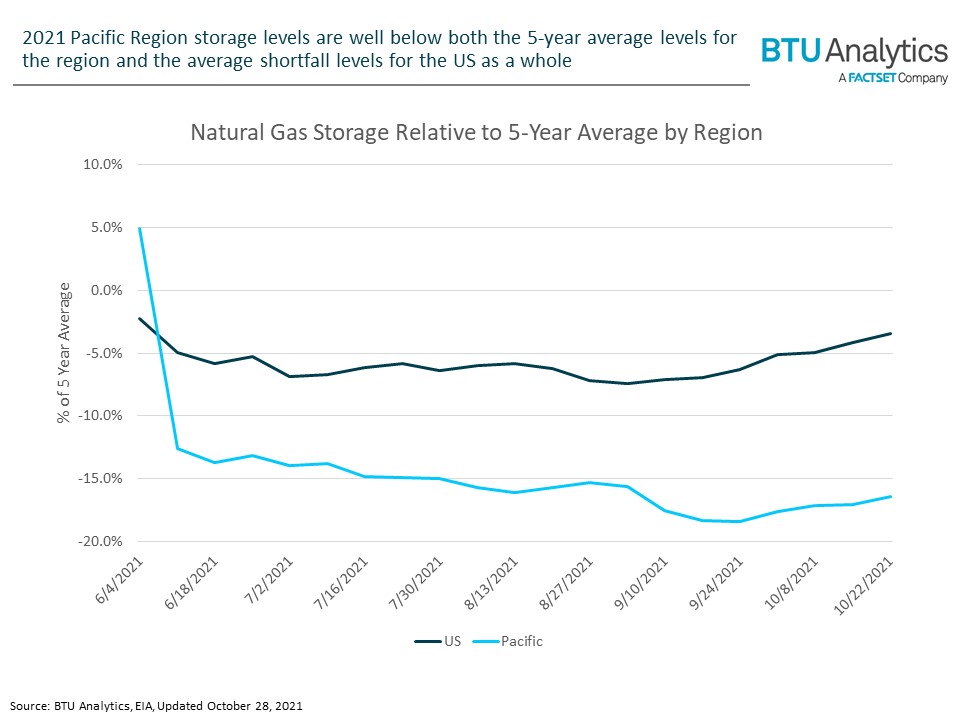
The EIA Pacific storage region, which corresponds to the West Coast, entered the summer in relatively good shape at 4.9% above the 5-year average. However, the spread between storage levels and the 5-year average increased throughout the summer and the region enters the winter at levels 16% below the 5-year average.
The reasons for the deviation from the historical 5-year average can be broadly classified into three groupings: availability of non-natural gas power generation, high electricity demand, and pipeline supply disruptions.
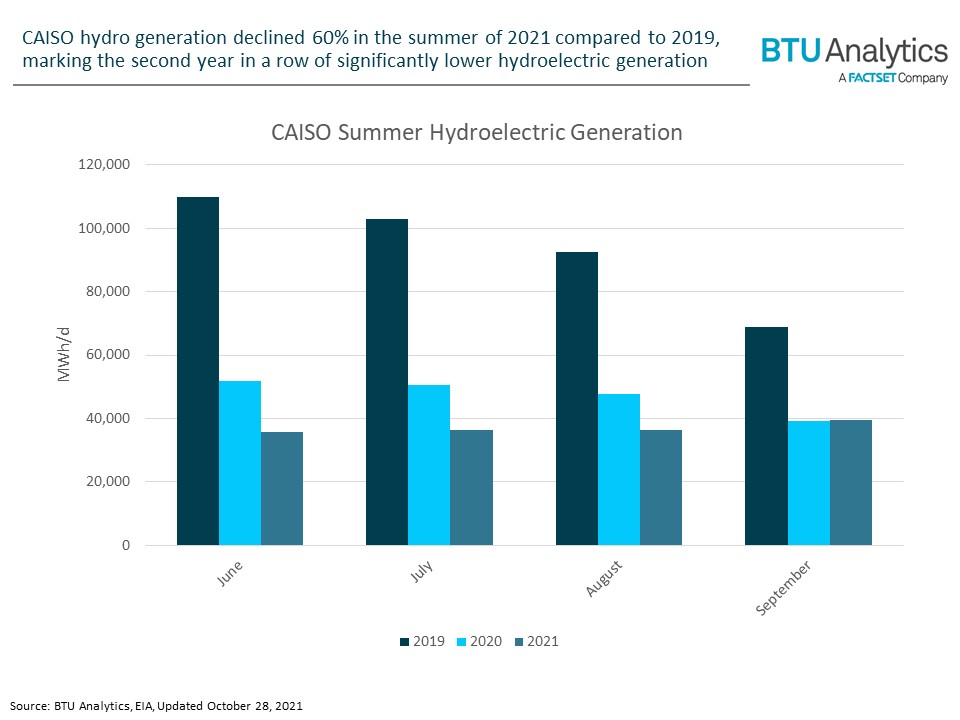
In 2019, CAISO (California ISO) averaged 93,603 MWh/d of hydroelectric generation in June through September representing ~19% of the total generation resource mix in these months. In 2021, due to decreased availability resulting from widespread drought, hydroelectric generation in June through September fell to just 37,043 MWh/d and represented only 7% of the resource mix.
This decrease in hydroelectric generation would have left a large gap to fill even at constant levels of electricity demand. However, electricity demand was also 8% higher for these months in 2021 than it was in 2019, primarily due to extremely hot weather. This increase in demand left a much larger generation gap to fill. While incremental solar and wind filled a portion of this, a much larger share was covered by an increase in natural gas generation.
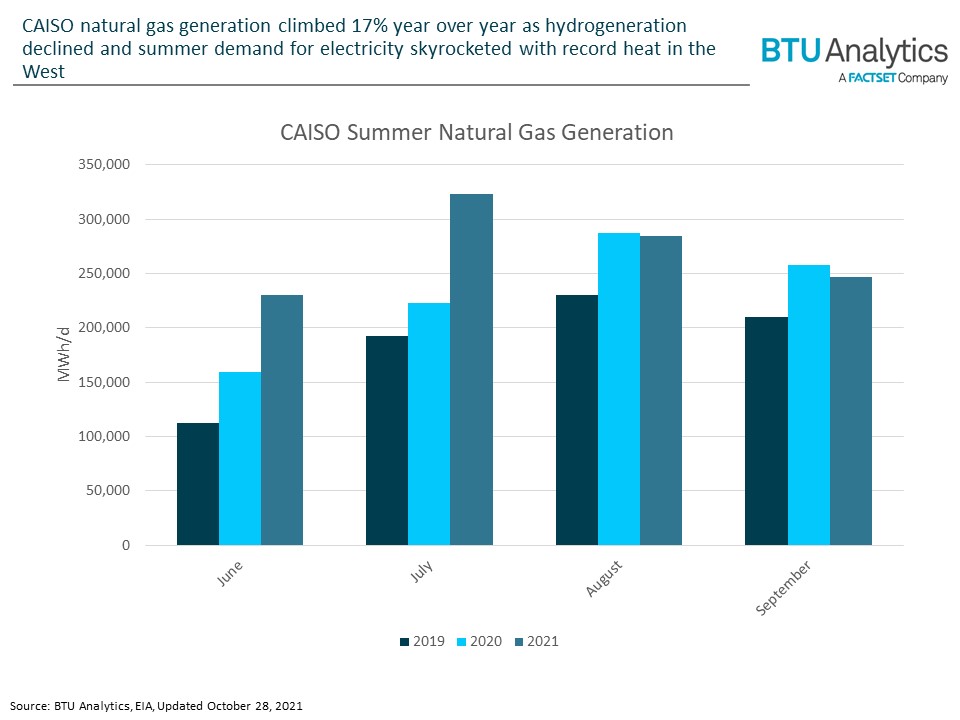
Over the last three years, natural gas fired generation in CAISO almost exactly mirrors that of hydroelectric generation. In the summer of 2019, natural gas generation averaged 186,124 MWh/d or 38% of the generation total. In 2021, natural gas generation averaged 271,209 MWh/d or 51% of the generation total. The rise in natural gas generation covered the gap left by decreased hydroelectric generation as well as much of the additional demand created by record temperatures in the Western US.
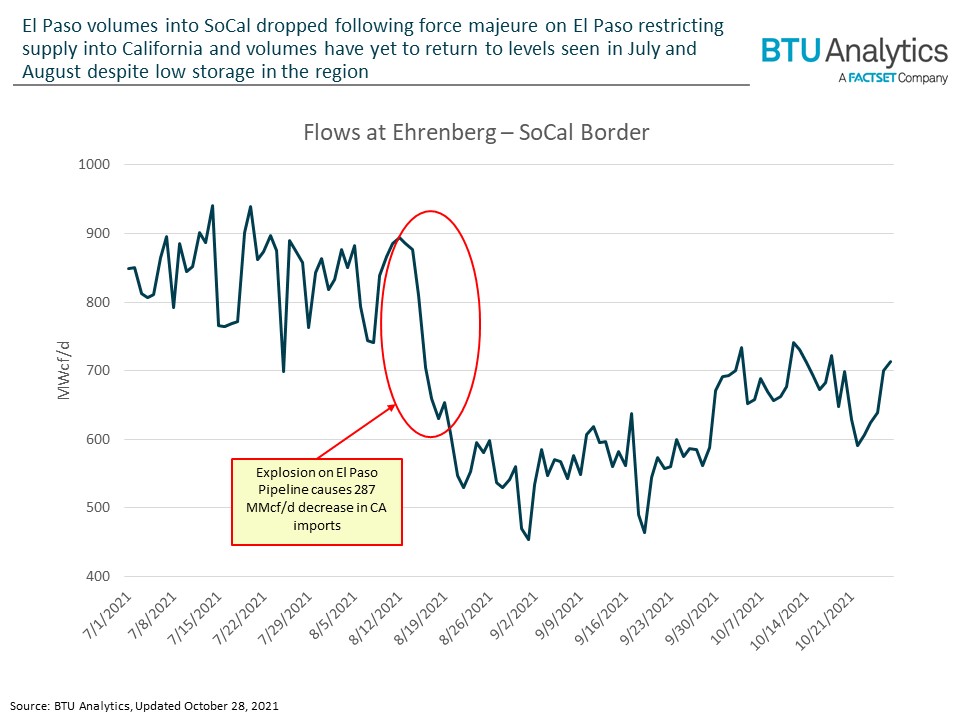
In addition to the increased demand for natural gas to meet electric demand, the region faced significant gas supply disruptions that exerted additional pressures on the system and further deterred storage injections this summer. Most notable of these was the force majeure event on the El Paso pipeline on August 15, 2021, due to a pipeline explosion near Coolidge, AZ. This incident caused an immediate drop in flows into Southern California and volumes averaged 287 MMcf/d lower through the end of August compared to the average of the five days prior to the explosion. Since the explosion, volumes have remained below levels seen prior to the event and currently are still 150 MMcf/d below pre-explosion levels as shown in the chart below.
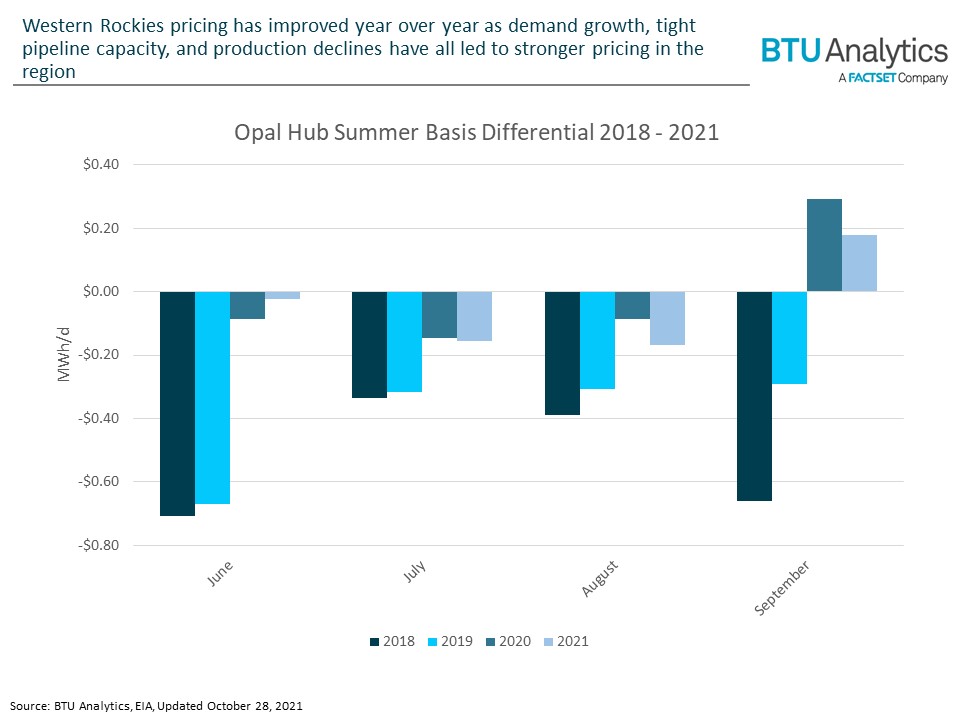
High demand and pipeline bottlenecks have resulted in premium pricing across the West as far back as the Rockies. The chart below shows Opal Hub summer basis to Henry Hub since 2019.
Years of weak gas pricing have led to production declines in basins like the Piceance and Green River Overthrust which help serve West Coast demand. This paired with low hydro, high temperatures this summer, and pipeline disruptions resulted in the Pacific region injecting only a net 61 Bcf this summer compared to 123 Bcf in the summer of 2020. As colder weather settles into the Western US, low storage inventories will be another pressure on a system that has already seen prices move to a premium to Henry Hub. For more on BTU Analytics outlook for winter natural gas prices and basis in the Western US, request a sample of BTU Analytics Gas Basis Outlook Service.


