


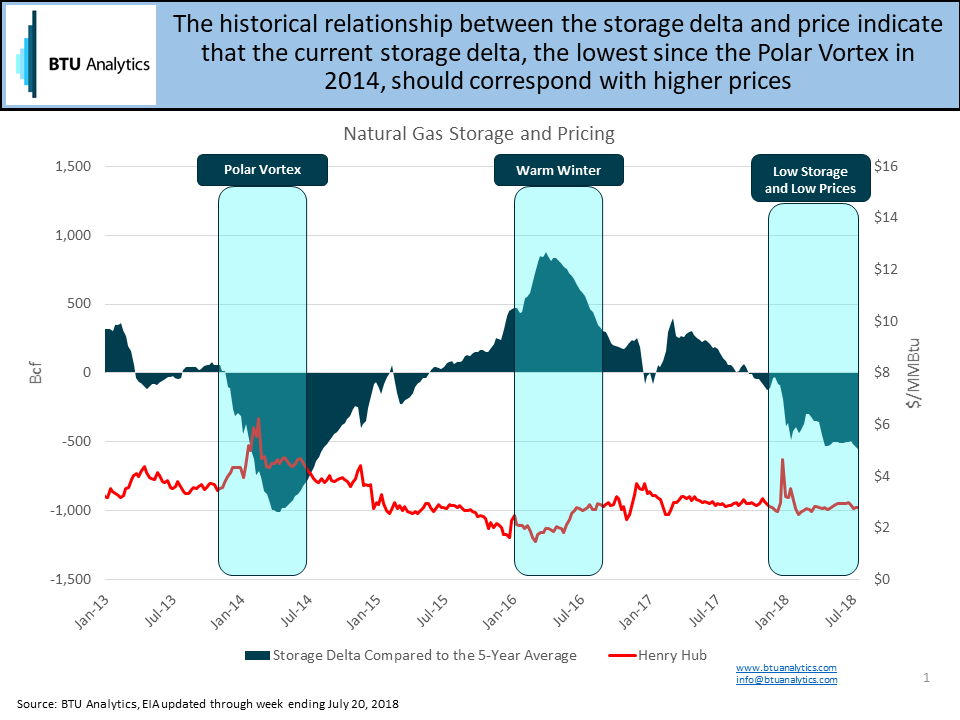
Just past the halfway point of injection season, US natural gas storage levels are at 2.27 Tcf, which is nearly 560 Bcf below the 5-year average storage level and only 29 Bcf above the lowest storage level at this point over the last five years (2014). The East and Midwest regions are trending particularly low as both fell below their 2014 regional low storage levels in June and have remained low in the weeks since. While storage levels have been trending low, pricing has remained relatively constant. In the past, prices have typically increased when storage levels have fallen below the 5-year average. However, so far this year, we have not seen an increase in pricing like we saw when storage levels dropped in 2013 and 2014. Today, we will take a closer look at injection rates in the East and how those might affect end of season storage levels and pricing as we head into winter.
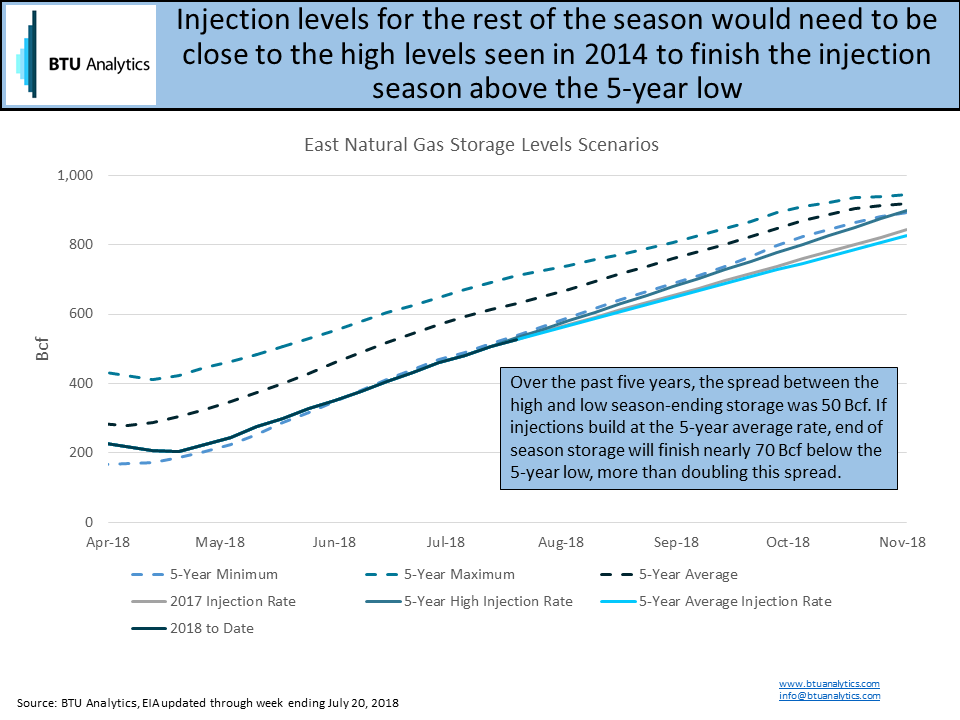
To understand what storage levels at the end of the season could look like, three different injection scenarios were analyzed using average injection rates between mid-July and November that we have seen in the past: 5-year average injection rate (2.89 Bcf/d), 2017 average injection rate (3.01 Bcf/d), and 2014 average injection rate (3.50 Bcf/d). These three average injection rates were applied for the remainder of this injection season to see where storage levels might be at the start of November. As shown in the graph below, injection rates will need to mirror 2014’s pace to avoid resetting the 5-year low. Injection rates equal to the 5-year average would lead to season-ending storage levels nearly 70 Bcf below the previous minimum.
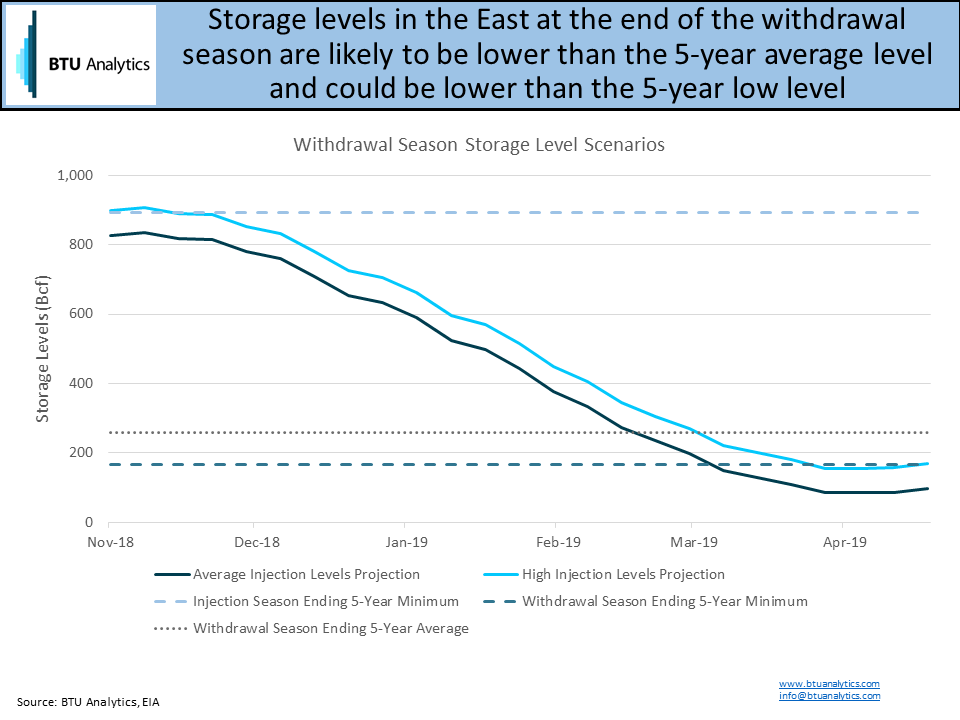
In a scenario where the upcoming winter is colder than normal, a low starting inventory level and high withdrawals could result in season-ending storage levels well below the 5-year minimum. The chart below shows the high and low injection scenarios described above if this winter’s withdrawal profile matches the withdrawals observed during the 2013-2014 winter along with the potential season-ending storage levels.
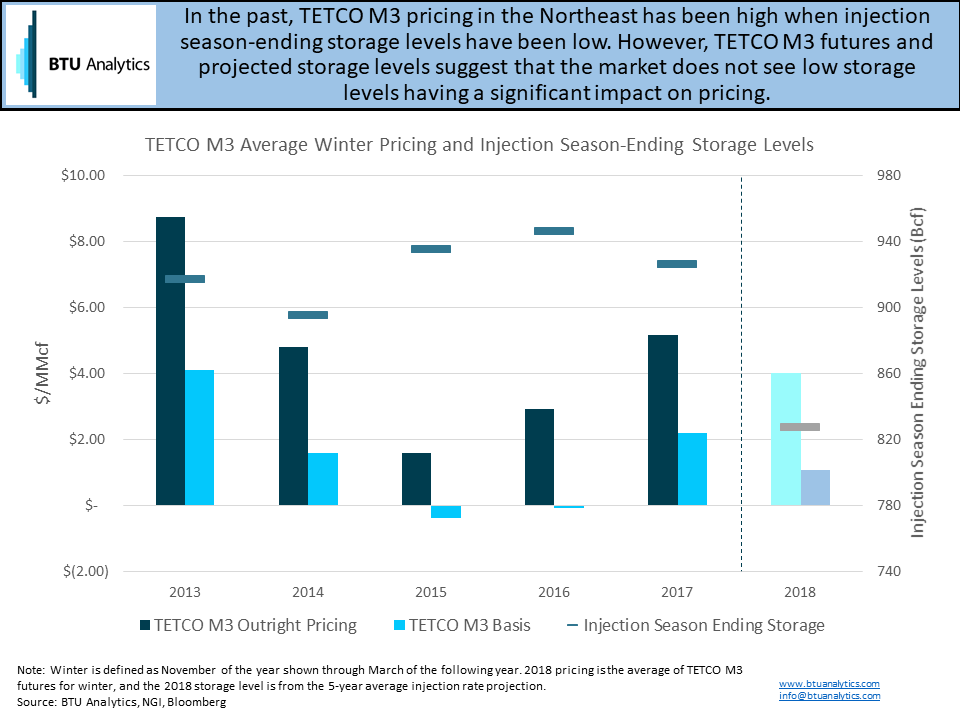
Low storage levels could lead to high natural gas prices in winter, especially if there is severe weather or extreme cold. Even as production in Appalachia grows, depleted storage reserves could result in incremental upward price pressure during cold spells, and an overall cold winter could result in prolonged price pressure and volatility. The chart below shows pricing for TETCO M3 over the past five winters along with the storage levels observed at the end of the injection season. Futures prices for the 2018-2019 winter show that the market expects low natural gas prices despite potential low storage levels.
Injections have been trending low so far in 2018, and remaining storage builds in the East need to average nearly 0.5 Bcf/d more than 2017’s pace from July through October to avoid setting a new 5-year low. Infrastructure and production can aid in that effort. Rover has lobbied FERC to approve the remaining two laterals, which would allow for 0.85 Bcf/d of incremental production growth, to help boost storage levels. However, production gains following the completion of the Rover laterals may be limited. The market is currently pricing that storage shortfall will not have a material impact to winter pricing, but has the market truly accounted for a potential supply shortfall, or will a warm winter prevent shortages from occurring in the first place?
For a more complete look at BTU Analytics’ outlook on natural gas storage in the US, request a sample of our Henry Hub Outlook.


