Natural gas liquid (NGL) infrastructure constraints impeded growth in 2018 and led to wider differentials between key NGL pricing hubs. Additionally, NGL fractionation capacity failed to keep up with rising demand. The gap in capacity led to stronger pricing for ethane relative to natural gas. To keep up with demand, several new fractionators will enter service over the next 24 months.
The geographic dispersion of the existing 6 MMb/d of fractionation capacity versus demand creates a semi-isolated system. As a result, excess NGL supply often fails to utilize spare fractionation capacity and vice versa. For example, Appalachian NGL pipeline capacity constraints limit the region’s ability to ship excess supply outside the Northeast. As a result of the isolation of Appalachia, BTU Analytics will exclude it from the analysis below.
Additionally, the Gulf Coast and Midwest consume most of the fractionated natural gas liquid supply. The concentration of demand adds to the bottleneck on NGL fractionation capacity. The chart below provides a breakout of lower 48 fractionation capacity excluding Appalachia versus BTU Analytics’ estimated Feb. 2019 NGL production. Conway and Mont Belvieu combine for 3.0 MMb/d out of the 4.7 MMb/d of fractionation capacity located outside of Appalachia.
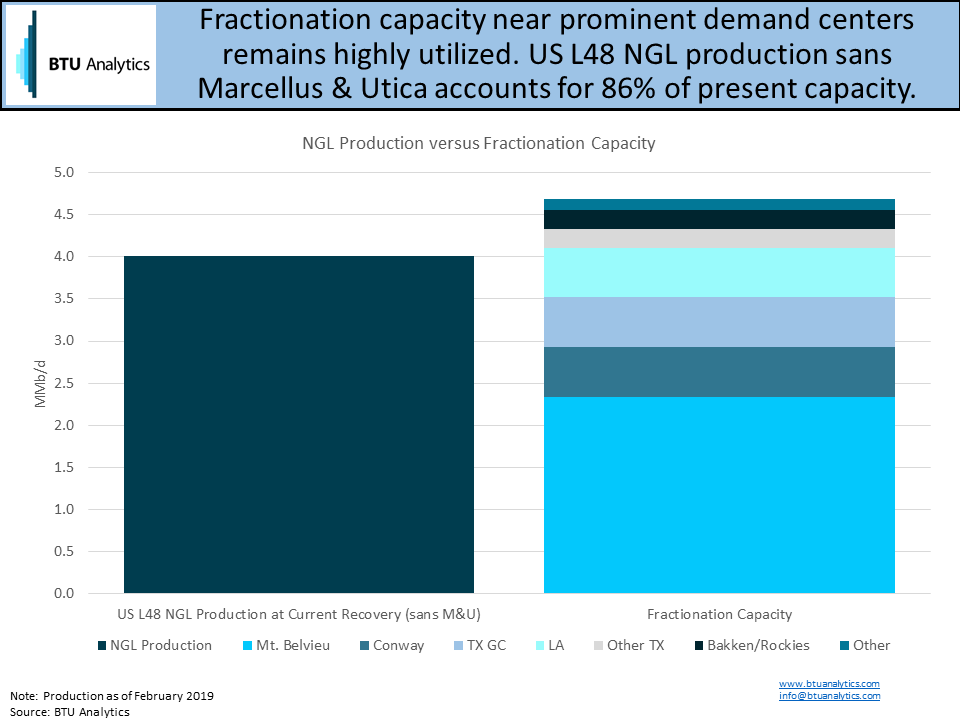
Excluding Appalachian supply, lower 48 NGL production likely surpassed 4.0 MMb/d in Feb. 2019. As a result, estimated utilization of fractionation capacity exceeded 86% in February. However, infrastructure constraints limit the ability of fractionation capacity located outside of the two hubs to run at high utilization. The inability to run all fractionators at nameplate capacity puts further pressure on the Mont Belvieu and Conway complexes. Consequently, all of the new fractionation capacity will be located at Mont Belvieu or along the Gulf Coast.
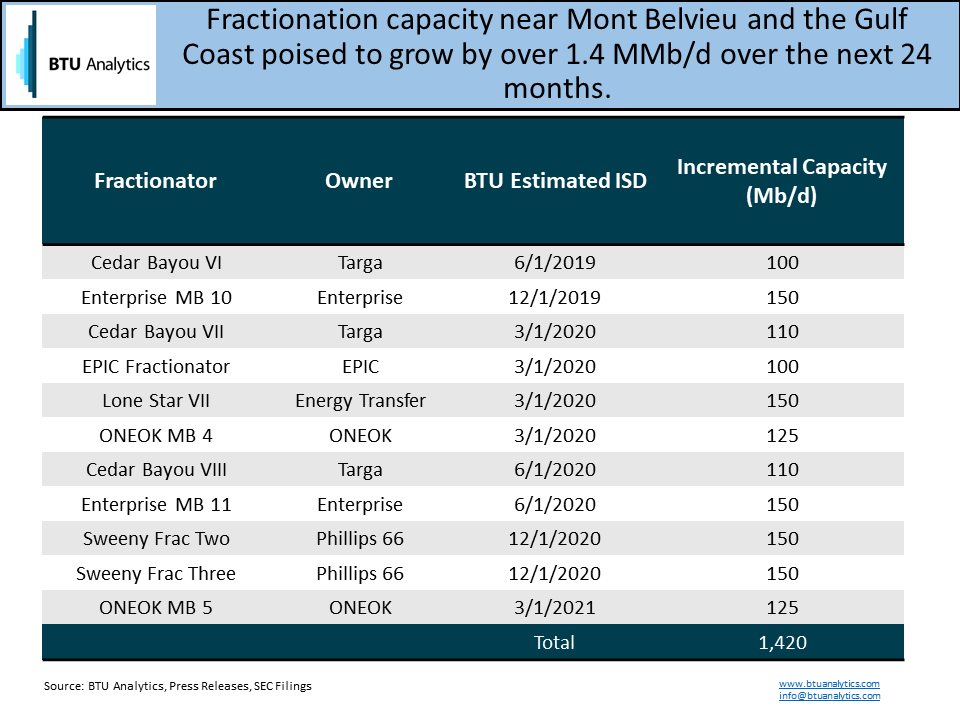
The table above provides a breakout of publicly announced NGL fractionation capacity expansions. Fractionation capacity additions in 2019 will be relatively small. Only two new facilities will enter service adding 250 Mb/d of capacity. However, by the end of 1Q21, just over 1.4 MMb/d of new capacity will enter service. With most of this capacity slated to become operational in 2020, it stands to reason next year will be a momentous step forward for NGL fractionation capacity.
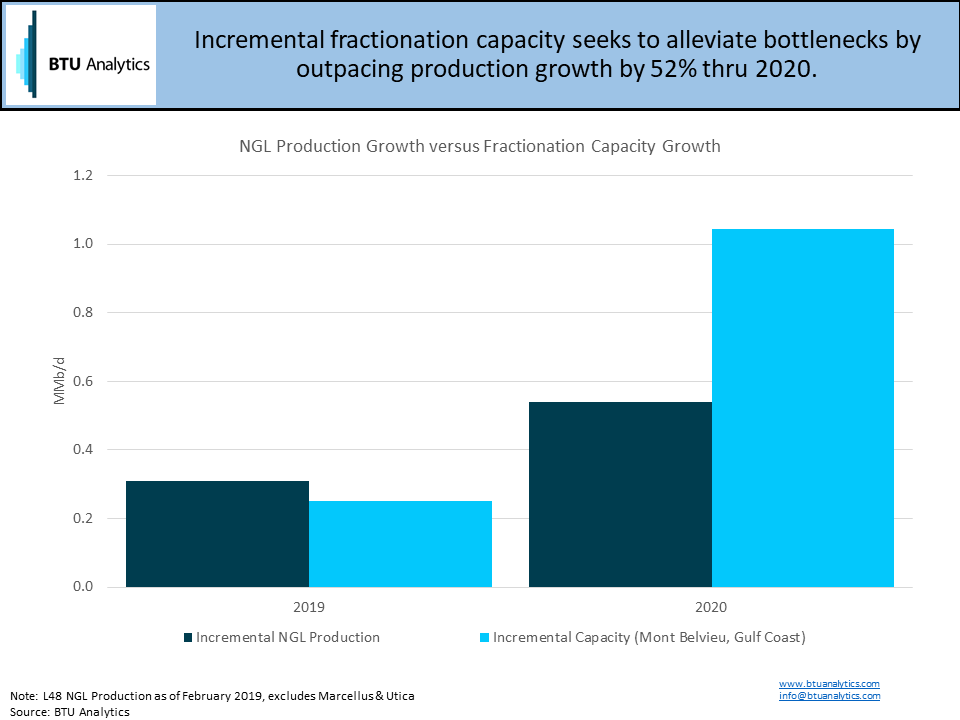
The cavalry is coming in terms of fractionation capacity buildout. However, most of the additions are slated for to mid to late 2020. The chart above uses BTU Analytics’ February 2019 Upstream Outlook NGL forecast to compare year over year growth versus capacity additions. In 2019, supply will continue to overwhelm new capacity additions. Indicating bottlenecks should continue to persist throughout the year. However, new fractionation capacity will outpace incremental production growth by approximately 52% by the end of 2020. Lower aggregate utilization bodes well for throughput stability when facilities go offline for maintenance. However, should supply growth continue at the same pace, bottlenecks may reemerge down the road.
To keep updated on the latest outlook for NGL production, please consider subscribing to BTU Analytics’ Upstream Outlook, where we analyze multi-stream production within 80 sub-locations across the US.