


Every month, the BTU Analytics analyst team spends days analyzing the latest data in drilling, well productivity, producer announcements, infrastructure timing, well economics, and commodity pricing to develop our latest oil and natural gas production forecasts in our Upstream Outlook report. Constantly evolving data requires a full team to keep on top of all these issues.
In order to develop a robust view on oil and natural gas production forecasts in the short and long term, each month BTU Analytics updates assumptions on initial production rates, decline curves, number of wells drilled, the number of wells turned to sales, and our expectation on changes in drilling activity for over 90 regions in the US and Canada. As an example, the chart below shows the change in expected EUR for a new horizontal well drilled in each of these 90 sub-locations since January of 2016.
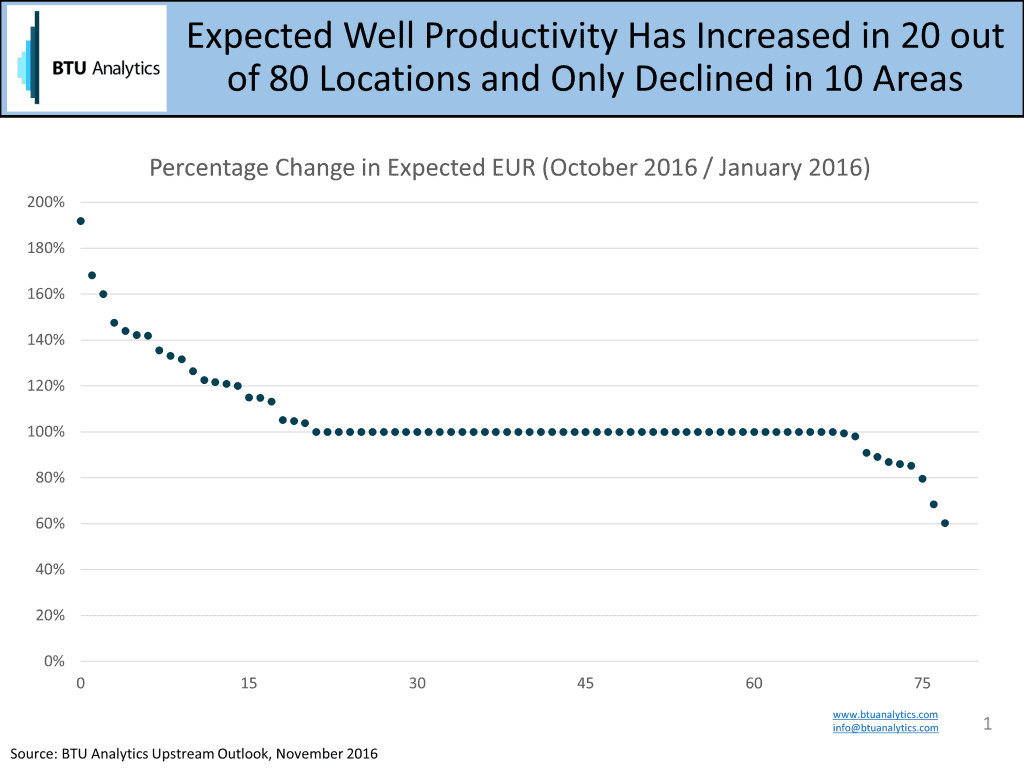
While only 30 of the regions have demonstrated significant changes since the beginning of the year, our team keeps a constant eye on the data in these other plays looking for signs of improvement or degradation in well performance.
Not surprisingly, the Permian, SCOOP, Stack, Marcellus and Utica regions dominate the top 20 in terms of well performance improvement in 2016. In addition though, we’ve continued to see better horizontal wells in the Uinta, East Texas, San Juan, and Barnett.
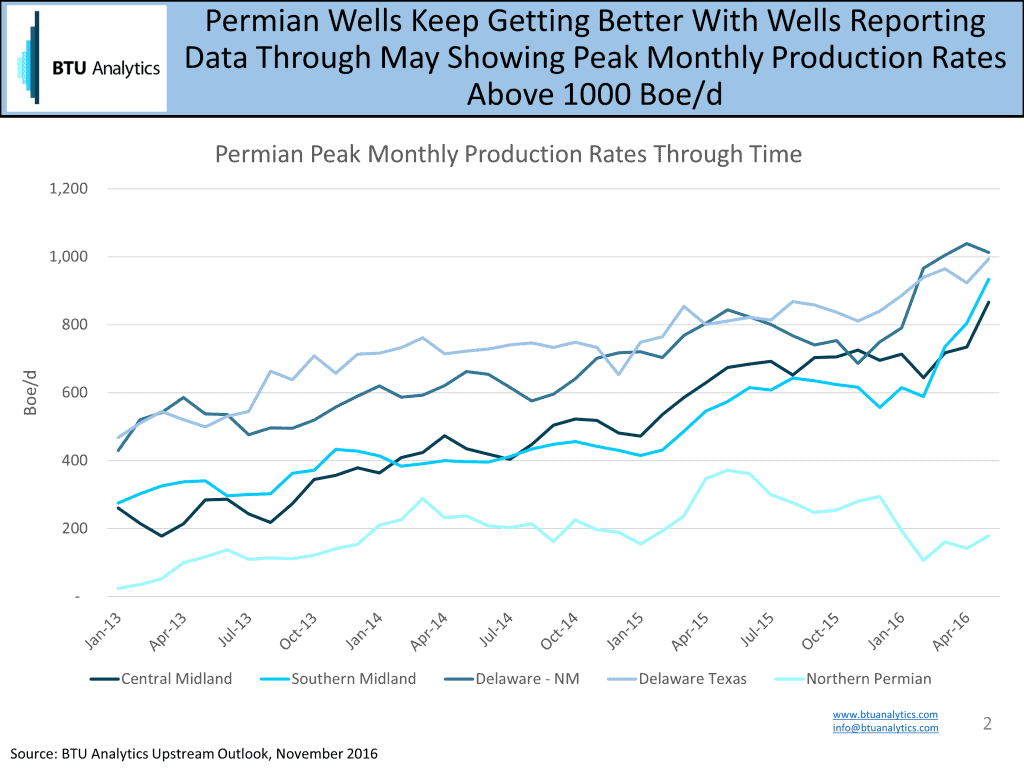
Reviewing the monthly peak production rate data in the Permian confirms why staying on top of the latest producer announcements and well production data can be valuable to developing oil and natural gas production forecasts. Across the five areas of the Permian, peak monthly production rates have climbed as much as 60% since May of 2015 with the Midland and Delaware areas now seeing the average new well in May of 2016 exceeding 900 Boe/d compared to 751 Boe/d at the beginning of 2016.
In addition to reviewing the micro-data outlined above, the BTU Analytics team considers the downstream ramifications to changes in our forecast. For instance, if producers are cutting activity, how quickly and to what magnitude will those cuts impact the long term supply and demand balance for natural gas and oil? As producers ramp up, will there be enough infrastructure to keep pace? Infrastructure constraints have long plagued the Marcellus and Utica and we are seeing the first signs of bottlenecks emerging in the Permian, which we will cover in-depth in our upcoming November Upstream Outlook.
But the most valuable service we deliver to our clients is being deep in the weeds in understanding each one of the 90+ regions we forecast. Our clients are encouraged to call and ask questions about the topics relevant to their business and to gain a deeper understanding of our underlying assumptions and thought processes. If you are already a client, please don’t hesitate to call and interact with our team. If you aren’t yet a client, learn more about our Upstream Outlook and other services here.


