The energy industry is always chasing the next hottest trend, whether it was wholesale power trading in the 1990s, shale gas in the 2000s or unconventional oil in the 2010s. Each of these eras was driven by new technology and plenty of capital. Each era also had a cast of companies that pushed the edge of development and exhibited their own hubris and swagger. As always, as one era ends, a new one begins. Currently, a COVID-driven global recession has curbed oil and gas production growth for the time being. Meanwhile in the US, many large consumer-facing companies such as Facebook, Google and AT&T have sought renewable energy power purchase agreements to further bolster their appeal to consumers. One result is the most aggressive power generation development across all fuel types is now solar. This begs the question, are solar developers the energy industries next frackers? Is the massive buildout of solar development in the US another commodity cycle race to the bottom? Shale gas E&Ps had a decade of easy access to capital as equity markets funded ‘growth at all costs’ strategies. Are solar developers in the same position now or is this time different? This Energy Market Insight will compare historical shale gas production growth rates by play to development of solar generation by ISO to see which development process is more aggressive.
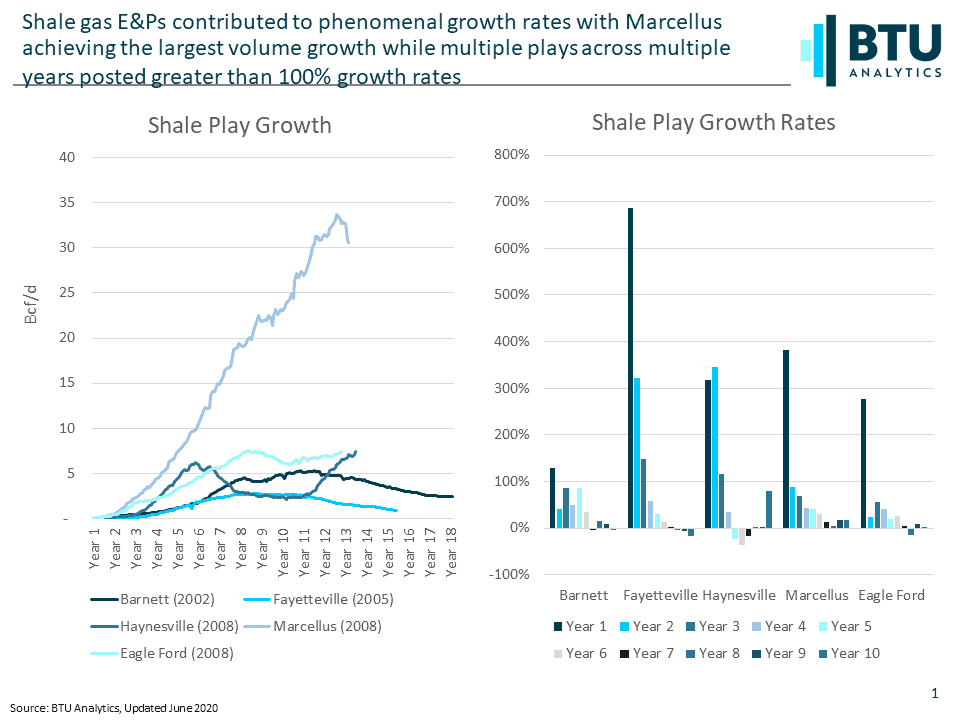
As shown above, shale gas plays achieved phenomenal growth in the early years of development starting in the early 2000s. When looking at growth rates, all plays had multiple years where production grew by more than 100% year-over-year. In addition, the Fayetteville, Haynesville, Marcellus and Eagle Ford all had at least one year-over-year production growth gain of over 200%. The Marcellus was the most prolific shale play and production grew on average at a rate of 64% per year for ten years. The Marcellus achieved the largest volumetric growth driven by a combination of superior rock and proximity to the largest demand centers in the US.
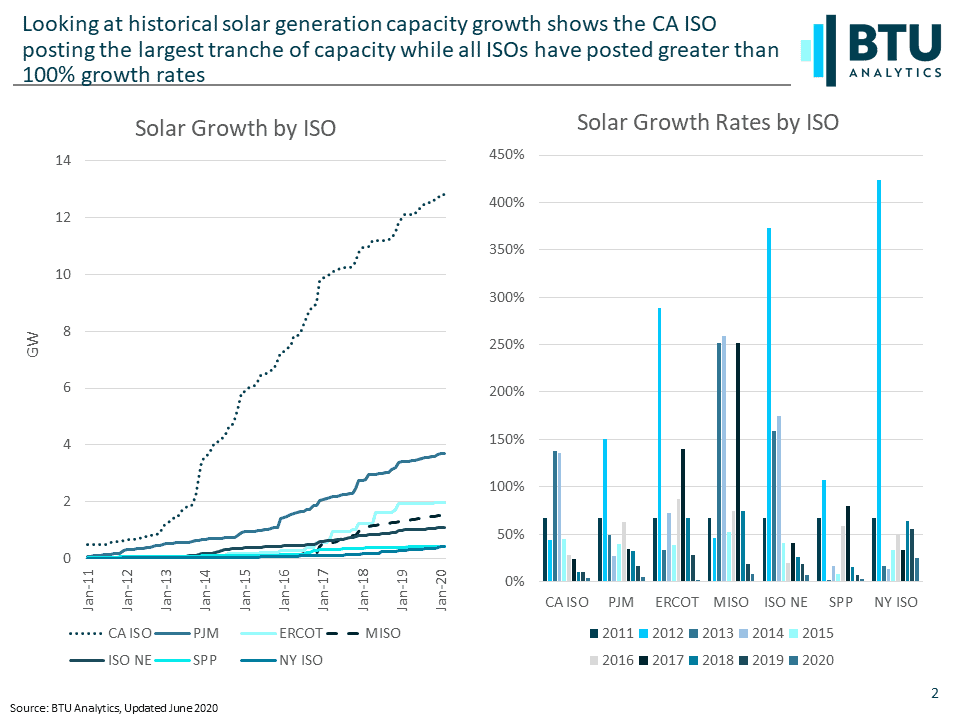
As a comparison, if we look at the historical growth of solar development by ISO, we can see that the CA ISO, PJM and ERCOT represent the three largest tranches of capacity as shown above. Currently, the US L48 has approximately 40 GW of solar in service, compared to a total of just over 1,000 GW of total generation capacity across all fuels. When we look at solar development growth rates year-over-year by ISO we can see that every ISO has achieved greater than 100% increases since 2011. Historical year-over-year growth rates have increased over the last ten years for CA ISO, PJM and ERCOT by 50%, 48% and 82% respectively.
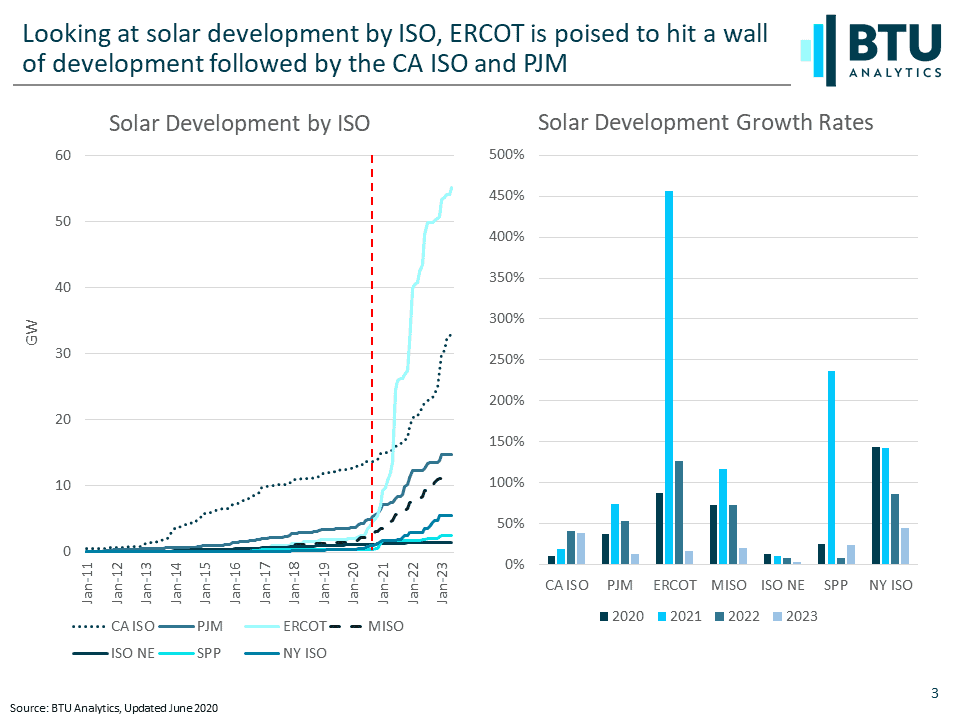
If we look at the future development using the BTU Power View where solar projects are vetted by BTU’s power team and assigned a BTU Grade for the likelihood and timing for development, we can see the wall of development lying ahead, especially in ERCOT. Like the Marcellus, does a superior resource (West Texas solar radiance) proximate to the large demand centers of Dallas, Houston, San Antonio and Austin create a unique solar development opportunity in ERCOT? If we look at annual solar growth rates by ISO of BTU vetted projects under development through 2023, ERCOT, CA ISO, PJM and MISO could average as much as 171%, 27%, 45% and 71% growth respectively as shown above. It would appear solar developers could be poised to outpace shale gas developers in terms of capacity growth.
To put the above into perspective, the US has approximately 1,000 GW of generation capacity. Solar currently represents just 40 GW or about 4% of installed capacity. Currently, BTU estimates another 153 GW will be developed through 2023. The energy markets never stops evolving and these competitive dynamics highlight that evolution. To follow the power generation development race and find out more about the solar, wind, and natural gas projects under development, request more information about BTU Analytics’ Power View.