Entering 2019, a common question of clients has become what will be the impact of new low-cost, high-output, utility-scale lithium batteries be on the natural gas market. The impact of batteries on the generation market could be meaningful. When paired with generation from wind and solar, batteries provide the panacea to intermittent renewable generation. Battery output data has been limited until recently. Since April 2018, the California ISO has been posting an aggregated ‘battery trend’ on the ISO website which shows battery dispatch or charging in five-minute increments. Today, BTU Analytics will use this data and to analyze impacts to natural gas generation in California from batteries.
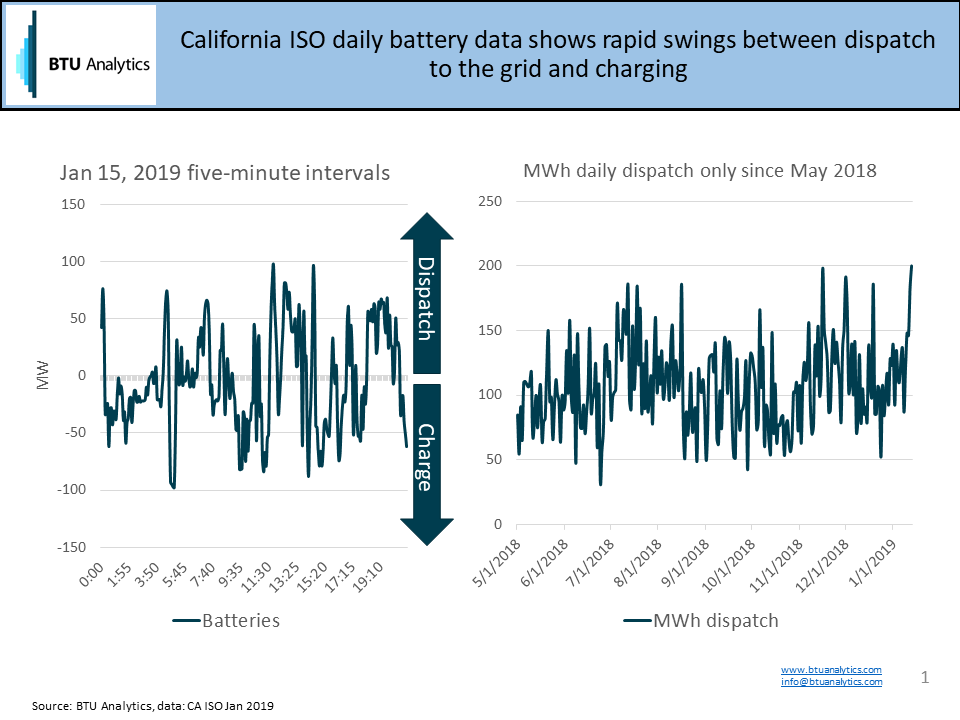
The California ISO battery data is an aggregate across all batteries on the ISO and highlights some surprising trends. The chart above on the left displays five-minute interval data for January 15, 2019. The data indicates dispatching to the grid and charging swing wildly throughout the day and up to 100 MW. In aggregate, the batteries are not simply charging when the sun is up and the wind is blowing. The biggest swing in a 15-minute interval was 208 MW for the day. Indicating in aggregate, the batteries went from full charge to full dispatch within 15 minutes. This also may imply batteries are providing a key role in ancillary services around frequency control.
The graph above on the right shows cumulative daily battery dispatch to the grid and excludes charging. On an average daily basis, dispatch averages 108 MWh per day since May 2018. For the below analysis, BTU Analytics assumes all battery charging occurs from wind and solar generation. Additionally, all battery dispatch displaces natural gas generation provided by peaking plants. The average natural gas peaker plant heat rate in California consumes 13 Mcf per MWh of electricity produced. Therefore, battery dispatch represents approximately 1.4 MMcf/d of potential lost gas demand. Considering total California natural gas power deliveries have averaged 1.2 Bcf/d for 2018, the point is today, batteries are currently having a minor impact on natural gas generation in California.
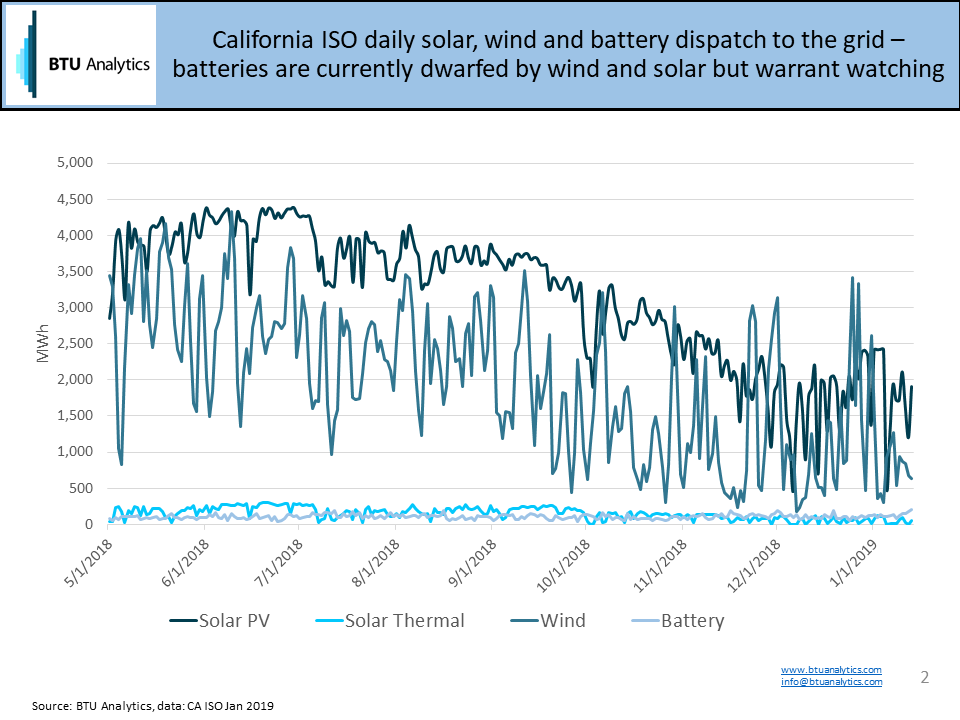
The slide above highlights generation from solar PV, solar thermal, wind, and batteries in California. Solar PV and wind generation dwarf generation from the other two sources. However, battery dispatch has recently surpassed thermal-solar generation in California. Note in winter, solar PV and solar thermal output drop due to seasonal reduction in daylight and solar radiance. According to the DOE Global Energy Storage Database, another 1.2 GW of battery and mechanical storage projects are proposed or under construction in California. And this estimate does not include the proposed 1.1 GWh Tesla lithium-ion battery storage project for PG&E near Monterey, CA.
The takeaway is today batteries are small volumes with high potential growth rates which warrants watching. To learn more about BTU Analytics’ coverage of renewables’ impacts on the gas market, request more information on the BTU Analytics’ Henry Hub Outlook which covers on a monthly basis BTU’s view on the current and future impact of wind and solar development on natural gas power burn.