As the energy transition accelerates, coal power plant emissions reductions continue to be an area of interest in the U.S. energy markets. Today, 294 coal plants remain in service in the L48 representing 234 GW of capacity with 69 GW having announced retirements through 2030. Due to the typically large scale of coal plants, the top 10 emitting CO2 coal plants represent 16% of total coal plant emissions. In this energy market insight, we will look at which coal plants have the largest CO2 emissions and how the generation markets are changing around the largest CO2 emitting plant.
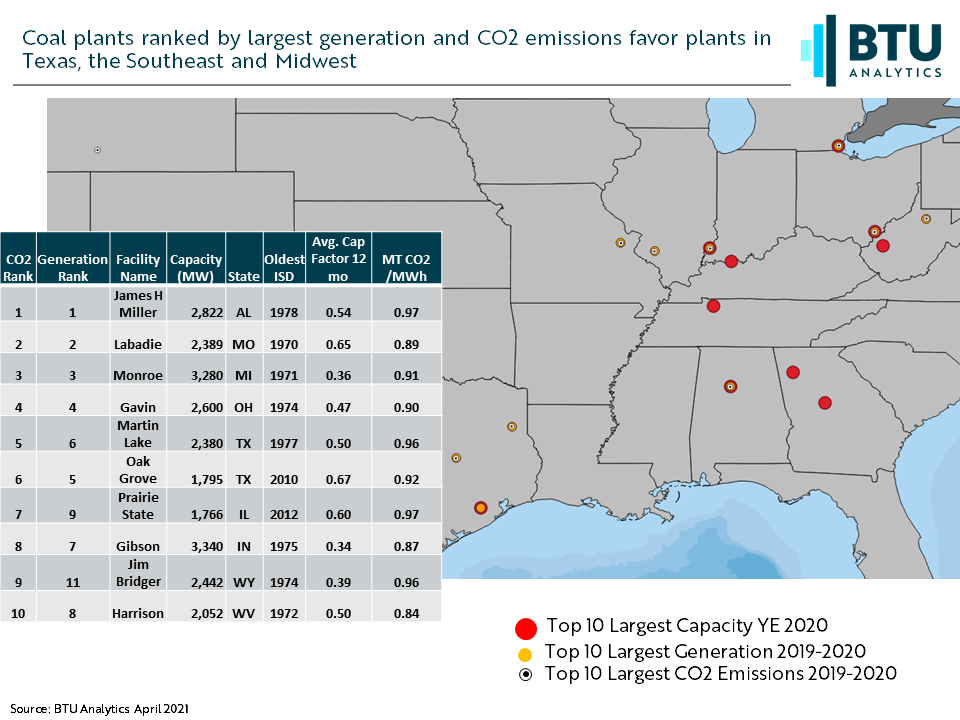
As shown above, the largest coal plants as measured by plant capacity, generation, and CO2 emissions are located predominantly in the Midwest, Southeast, and Texas. For the purpose of this analysis, generation and CO2 emissions were calculated for 2019-2020 using EPA CEMS data in BTU Analytics’ Power View platform. The James H Miller coal plant located in Jefferson county Alabama with 2,822 MW capacity has the highest CO2 emissions of any plant in the L48. While James H Miller is not the largest capacity plant in the L48, a combination of a relatively high plant capacity, a higher-than-average capacity factor, and a high emissions intensity of 0.97 MT CO2/MWh elevates its emissions level. As shown in the table, there is logically a close correlation between a coal plant’s CO2 ranking and generation ranking. Several plants make all three top 10 lists (plant capacity, generation, and CO2 emissions) and include James H Miller in AL, Monroe in MI, Gavin in OH, and Gibson in IN (shown on the map by overlapping black, white, orange, and red circles). However, five of the largest coal plants measured by plant capacity at YE 2020 do not make the top 10 CO2 emissions list due to lower capacity utilizations. These plants include the following coal plants (shown with red dots on the map): Scherer in GA at 3,654 MW, Bowen in GA at 3,499 MW, John E Amos in WV at 2,933 MW, Cumberland in TN at 2,600 MW and Rockport in IN at 2,600 MW.
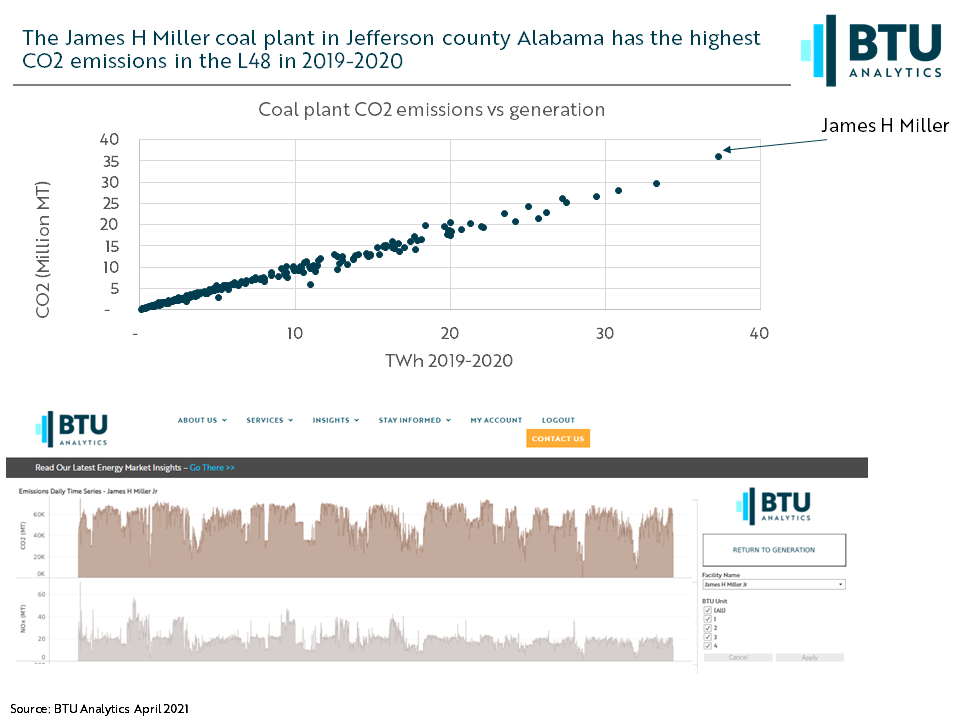
The plot above shows coal plant CO2 emissions vs generation and the linear relationship is clearly showing that coal generation emits in a pretty tight range of about 1 MT CO2 per MW generated. And when looking at the top 10 CO2 emitting coal plants as a group, they emit as much as the top 57 natural gas plants while these gas plants generated 15 times the amount of generation in 2019-2020. Due to interest in power plant emissions data, BTU Analytics has now added historical thermal plant emissions data at a unit level into Power View as shown above for the James H Miller plant. This data set includes CO2, NOx and SO2 going back to 2010.
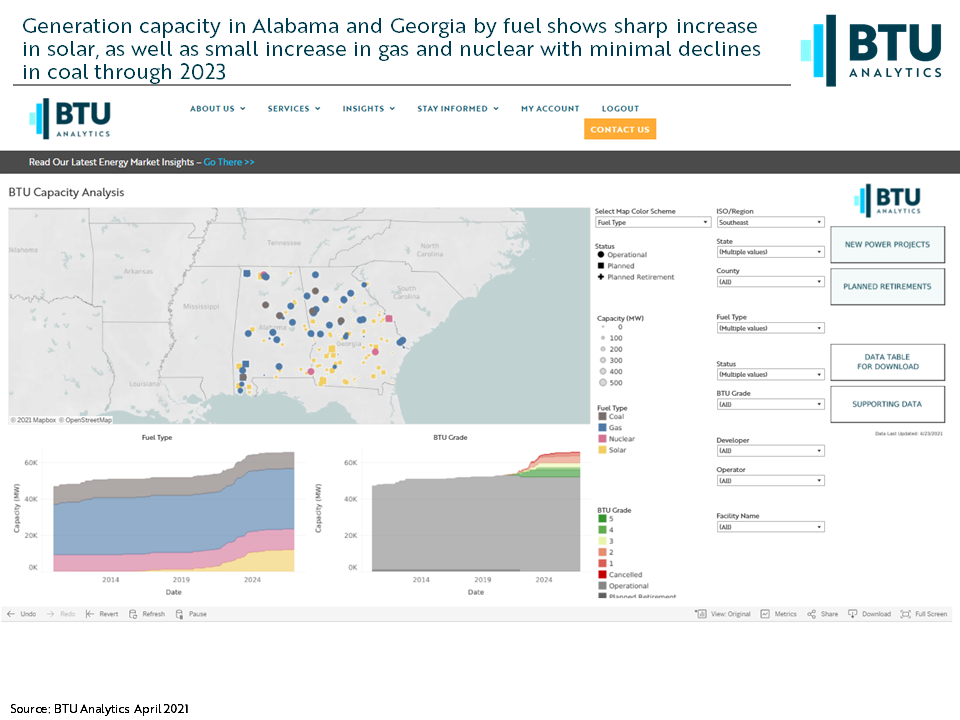
So how are the generation markets responding around the largest CO2 emitting coal plant – the James H Miller? Using BTU Analytics’ Power View Capacity Analysis tab, as shown above, we can see an increase in capacity coming by looking at the Alabama and Georgia power markets for this example. One ~900 MW unit at the Scherer coal plant in Georgia is set to retire in 2022 dropping coal to 9 GW by YE 2023. Meanwhile, generation capacity is set to increase for solar by 7.5 GW to 10.4 GW, for nuclear by 2.2 GW to 11.5 GW and for gas by 1.7 GW to 33 GW by YE 2023. Solar looks to take on coal in the Southeast in the next five years. To track further power development around large CO2 emitting assets request more information about BTU Power View.