For the last six years, BTU Analytics has helped guide our clients’ investment and strategic decisions in the oil, natural gas, and NGL markets. BTU is now bringing that same data-driven, independent analysis to the power market with the launch of our new tool, the BTU Power View. BTU has collected, condensed, and vetted data from more than 300 data sources into the Power View, that allows you to cut through the noise in the thermal and renewables power markets.
While the Power View includes BTU’s outlook on existing and retiring capacity and regional and asset level generation, in this commentary I will focus on our capacity outlook and BTU’s answer to a deceivingly simple question: How much wind and solar capacity is coming to market in ERCOT in the next few years?
The first place you might look is ERCOT’s interconnection queue. ERCOT’s queue is relatively clean, unlike most of the other 50+ interconnection queues around the US. The BTU Power View contains filterable displays and data on active projects in each interconnection queue around the country. Below I have already filtered projects down to ERCOT and then filtered out fuel types other than wind and solar.
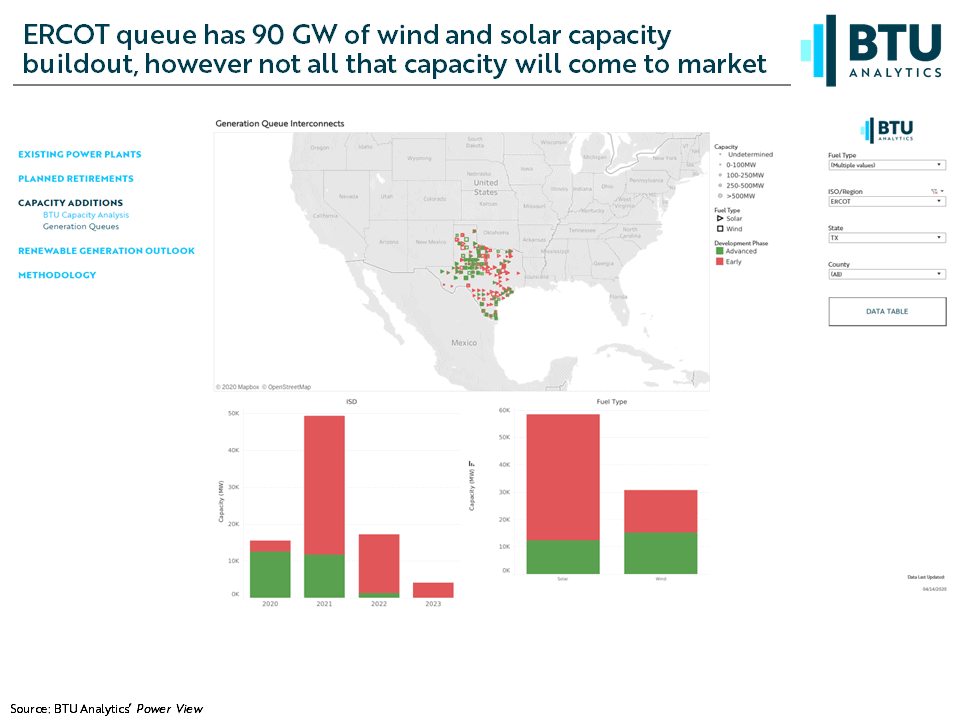
Looking purely at the queue shows staggering numbers, 60GW of solar and 30GW of wind set to come online seemingly in the next three years. If you owned a natural gas power plant or are a pipeline serving one of those plants, you would rightfully be anxious.
However, not all that capacity will make its way to market. Each of those projects has risk associated with it that may prevent it from coming to market. That’s why BTU has developed a BTU Grade for each project, that leverages BTU’s data collection, analysis, and vetting of a multitude of federal, state, local, and other sources. The zero to five scale ranges from projects that have been cancelled (Grade: 0) up to projects that have secured financing and a PPA (Grade: 5).
Now let’s use the Power View and BTU Grade to refine the outlook on ERCOT wind and solar development. Below I have filtered again to ERCOT and will filter down to wind and solar projects, providing a breakdown of that 90 GW of development in the queue by its vetted BTU Grade. The map shows wind and solar projects in light green and yellow dots, respectively, while the column charts at the bottom of the page shows the BTU Grades for the projects on the map, ranging from Grade 1’s in red and Grade 5’s in dark green.
Taking into account BTU Grades shows less than 25 GW of renewables development coming to the ERCOT market, not nearly the magnitude you may glean from looking solely at the ERCOT queue. Want more info on the projects shown? Simply zoom and select any number of plants to view and download from BTU’s database of information on those projects. This has major implications to power producers and developers, gas producers and midstream operators. BTU Analytics has incorporated this level of power anlaysis into our macro gas view but now makes this detailed view of the power market available to its clients in the BTU Power View.
BTU is excited to bring the same quality of analysis our clients have come to count on to the power market. Look for more commentaries in the future highlighting other features of the Power View.
COMPLIMENTARY WEBINAR ON 6/3/2020
Whether you’re building a new power generation resource or own an existing asset, the risks around new capacity buildout could turn an investment decision from black to red. And with a swing towards investments flowing into renewable energy projects, it is becoming more difficult to sort out what projects will actually come to market versus what just inflates the power generation queues. In this webinar, BTU Analytics assesses the nuances around new capacity buildout in the US and how it will affect surrounding assets.
Topics to be discussed:
– Understanding what generation projects are unlikely to come to market, versus projects with market traction
– How to assess new renewables and thermal capacity along natural gas midstream footprints
– Determining what projects you are competing within your neighborhood
![]()