Since 2008, coal plant retirements have totaled 81 GW across 696 units at 360 plants. Those retirements were driven by a combination of factors including competition from natural gas and renewables, as well as federal emission regulation. Coal plant retirements have been a market opportunity for natural gas producers historically. This Energy Market Commentary will look at the evolution of past coal plant retirements as well as planned future retirements. As coal retirements have migrated west over time, strong renewables development in the West will erode much of the potential future benefit of coal retirements for natural gas producers.
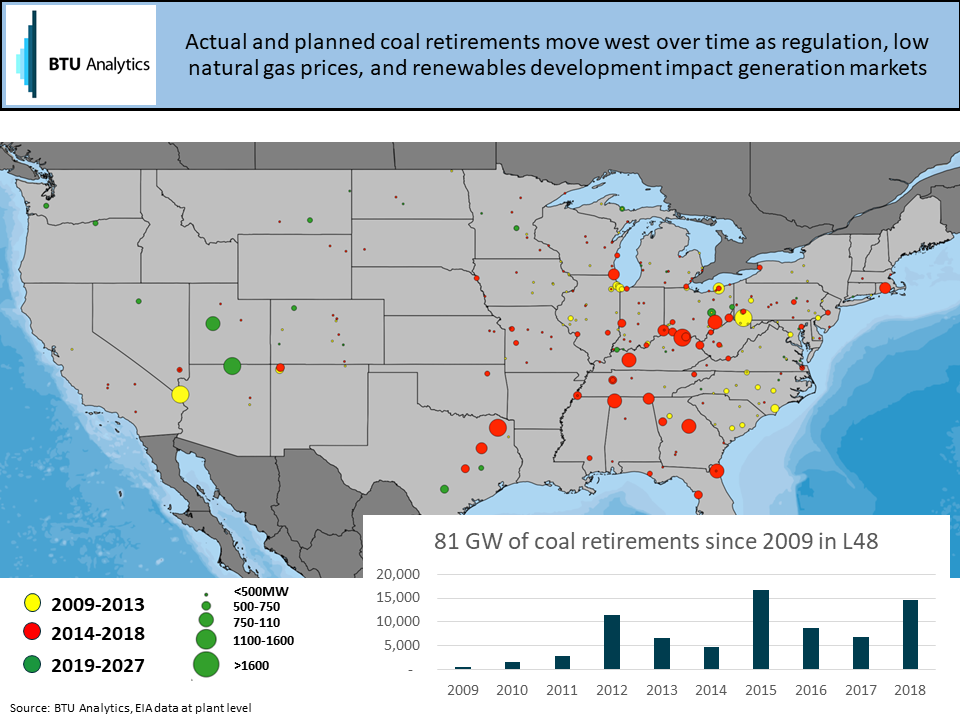
As shown above, coal plant retirements have migrated east to west over time where yellow followed by red show historical retirements, while green show planned future retirements. The biggest drivers of coal plant retirements have been the combination of 1) regulation in the form of the 2011 EPA Mercury and Air Toxics Standard (MATS) rule and the Clean Power Plan (CPP), 2) low cost shale gas, and 3) more recently robust wind and solar development.
In brief, MATS forces coal plants to add scrubbers to meet tighter emissions standards driving coal plant costs higher. The CPP encouraged carbon emissions reductions across the US to the benefit of renewables and energy efficiency. (Note: the future of MATS is uncertain as the current administration is reviewing changes to the rule and the CPP is also in the process of being repealed. This piece will not address these regulatory risks.)
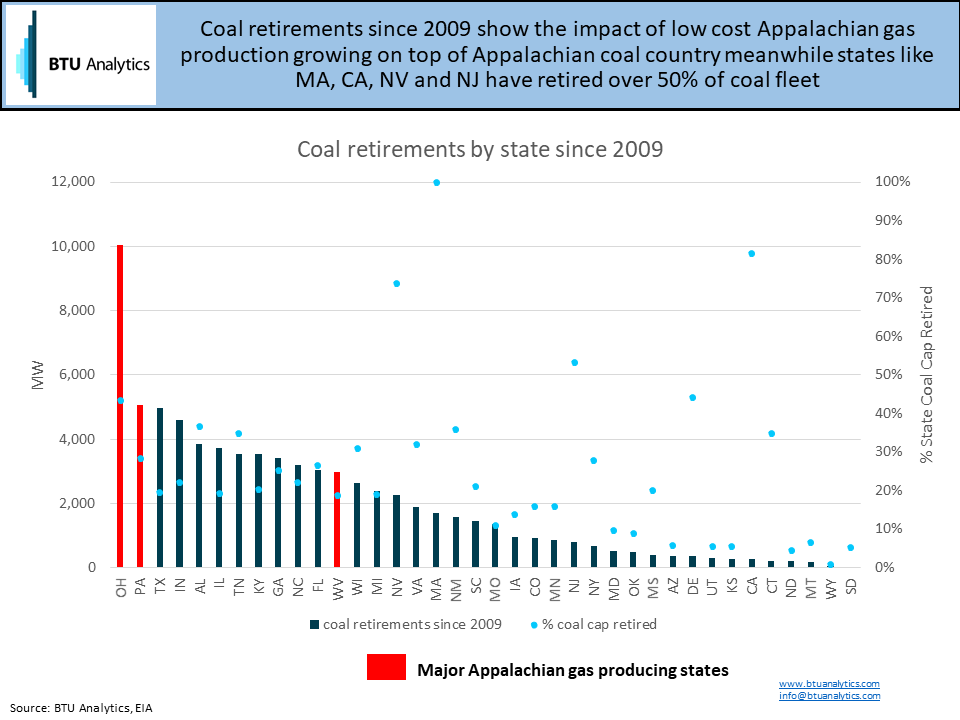
Additionally the growth of Appalachian gas from 2 Bcf/d in 2009 to over 30 Bcf/d today drove many coal retirements in and around Appalachia as shown above. Low cost shale gas drove the operating cost down for existing gas plants and also brought a wave of combined-cycle gas plant development across the US.
Marcellus and Utica gas production growth in the heart of Appalachian coal country resulted in Ohio and Pennsylvania leading all L48 US states since 2009 in terms of gross coal retirements as shown below. Ohio and Pennsylvania have lost 43% and 28% of 2009 coal capacity, respectively. Meanwhile, in some politically left leaning states, like Massachusetts and California, coal fired capacity has been nearly or totally eliminated.
Looking forward to planned coal plant retirements, we can see below that many of the retirements will be focused in the US West. In a previous commentary, BTU highlighted The Great Renewables Divide which shows the impact of double digit wind and solar development growth in many western states as measured from 2013 to 2018 in the analysis. Through 2027, 19.3 GW of coal plant retirements have been announced, with over 10 GW being located in states west of the Mississippi River.
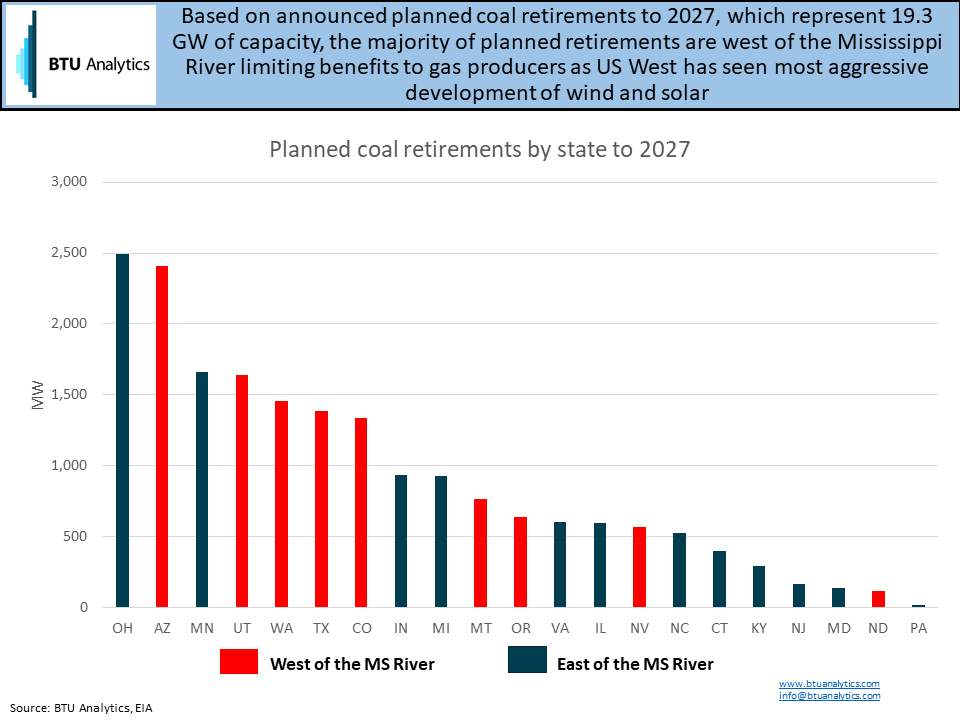
Gas producers that are banking on coal retirements to be a driver of gas demand going forward may be disappointed. In the West, due to the quality wind and solar resource, strong renewables development is expected to continue. When paired with coal retirements moving west over time, the opportunity for gas demand growth from coal plant retirements will be diminished. To follow BTU Analytics’ coverage of the power generation markets request more information on the Henry Hub Outlook.