Last week, climate change took center stage when the “Green New Deal” was promoted in Washington DC. The Green New Deal, though, is not the only new proposal on the table. Initiatives across the US are being proposed to reduce greenhouse gas emissions (GHG) in other ways. Chevron recently announced that it would tie compensation for its management team to emission reduction targets. In the Senate, a new bipartisan bill seeks to aid the development of carbon capture technologies. Additionally, last week in Oregon, House Bill 2020 was introduced to bring an emissions cap-and-trade program to the state. If passed, Oregon joins California and a coalition of states in the Northeast in the utilization of a cap-and-trade system to reduce emissions.
The first GHG cap-and-trade program in the US was the Regional Greenhouse Gas Initiative (RGGI) established in 2009. RGGI consists of nine states: CT, DE, MA, MD, ME, NY, NH, RI, and VT. RGGI requires thermal power plants to hold allowances equal to their emissions over a three-year reporting period. The chart below details the historical emissions and the cap for the first three periods of the program.
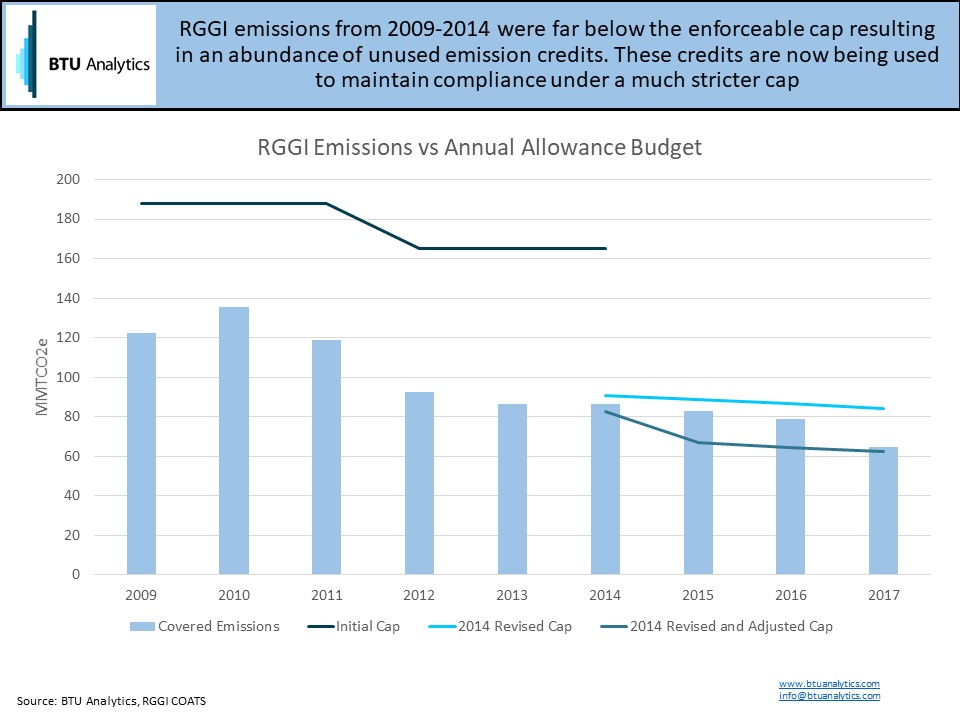
From 2009-2014, the emissions cap exceeded emissions significantly. Thus, generators were able to bank unused emissions credits for future periods. Following a comprehensive program review in 2012, RGGI reduced the cap by over 40%. To account for the abundance of banked allowances, the cap was further adjusted lower from 2014-2017. Emissions exceeded the adjusted cap each year lowering the supply of banked allowances. However, in 2017, emissions have nearly hit the adjusted cap. The drop in emissions resulted in the clearing price for RGGI credits to fall. In 2016, credits priced at $7/ton. In 2017, the price had fallen to just $3/ton. The growth in natural gas fired generation in Appalachia as a result of Marcellus and Utica production spurred the substantial decline in emissions.
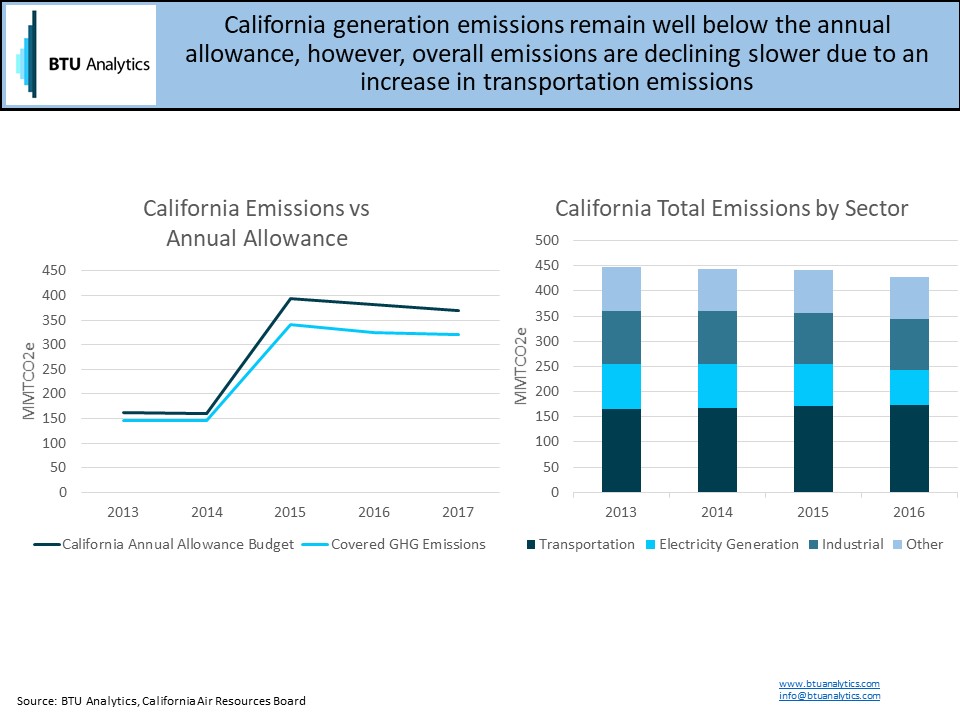
In California, emissions have also fallen below the cap. Unlike RGGI, the California cap-and-trade program covers the entire economy, not just the power sector. However, just like RGGI, the cap in California has yet to provide any real limit on emissions. Since expanding coverage in 2015, total emissions have remained approximately 14% below the required cap. Yet, overall emissions continue to decline in the power sector. Power sector emissions have fallen nearly 23% since 2013 with the closing of coal plants and increased use of natural gas and renewable generation. In that same period, however, transportation emissions have risen 5% and now account for 40% of total emissions in California.
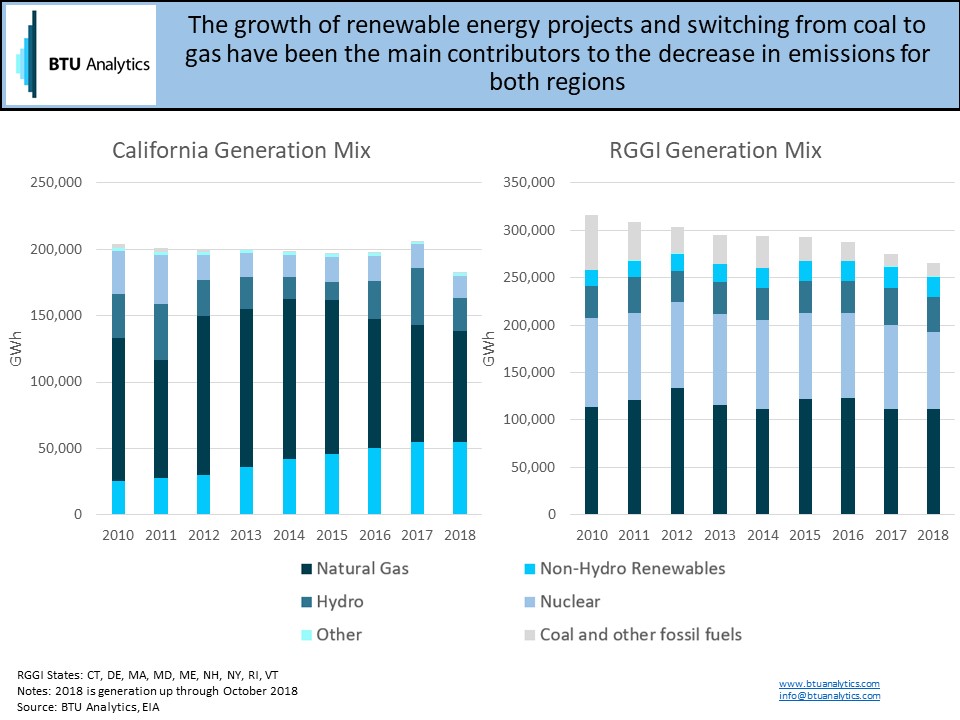
Proponents of cap-and-trade systems will point to the overall decrease in emissions as a sign that the programs are effective and working as intended. Whether cap-and-trade is the mechanism driving this change remains up for debate. What is not up for debate is the shift in the generation mix over the past decade. Renewables’ growth is up in both regions accounting for over 25% of generation in California and 8% in RGGI. Coal plant retirements and expansion of efficient natural gas combined cycle plants decreased coal generation in the northeast over 75% from 2010 levels. The switch to natural gas, rather than growth in renewables, accounted for the majority of decline in emissions.
The future of emission cap-and-trade programs in the US may ultimately hinge on the success of RGGI and California over the next several years. If emissions continue to decline in the face of increasingly strict emissions caps, we may see cap-and-trade programs become more prevalent in the US. However, if the decarbonization of the US generation stack continues to outpace cap-and-trade limits, the overall effect of these programs will continue to be limited. To follow BTU Analytics’ coverage of the intersection of the natural gas and power markets, subscribe to the Henry Hub Outlook.