Our previous Energy Market Insight reviewed wind generation curtailments in ERCOT and how power prices respond to generation curtailment. In this Energy Market Insight, renewables curtailments will be explored at a regional and plant level to understand where curtailment is most likely and at what magnitude.
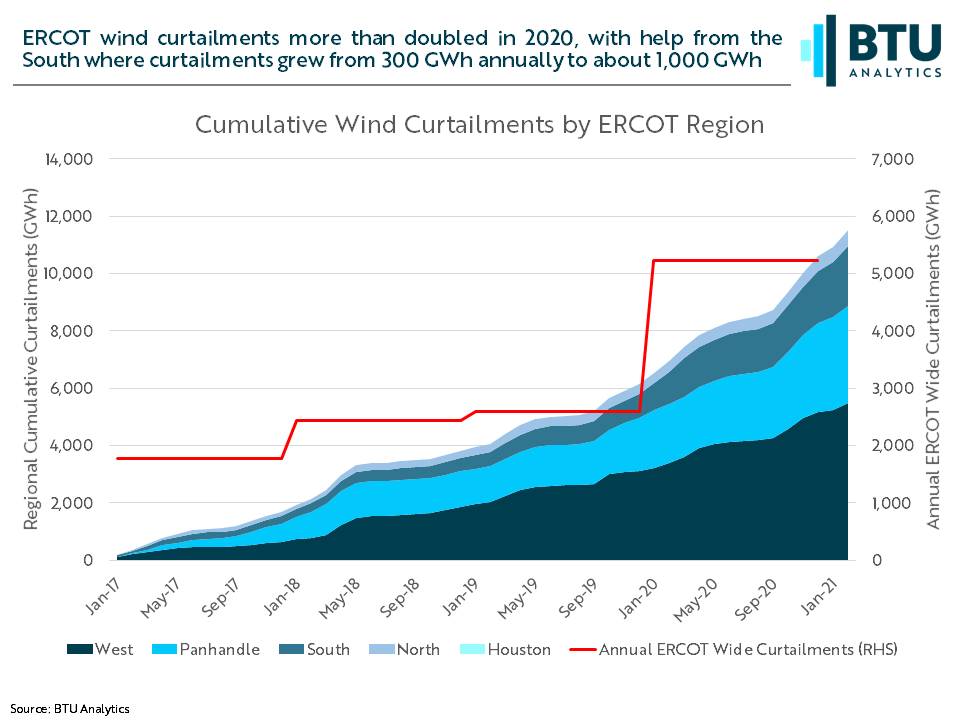
First, let us look at how wind curtailments have changed through time. The graphic below shows cumulative wind curtailments since 2017 with annual ERCOT curtailments shown as the red line corresponding to the right axis. Between January 2017 and March 2021 wind generators have cumulatively curtailed almost 12 TWh out of 322 TWh of total wind generation. To put that in perspective, that’s enough generation to serve the Lower 48 for about a day. The rate of curtailment though increased dramatically in 2020, more than doubling the level of curtailed generation in 2019.
As shown above, curtailments grew across all regions. However, within regions, were curtailments evenly distributed across generators, or did a few disproportionately contribute? The dots in the scatterplot below represent wind generators in ERCOT with that generator’s total generation on the x-axis and its curtailments on the y-axis.
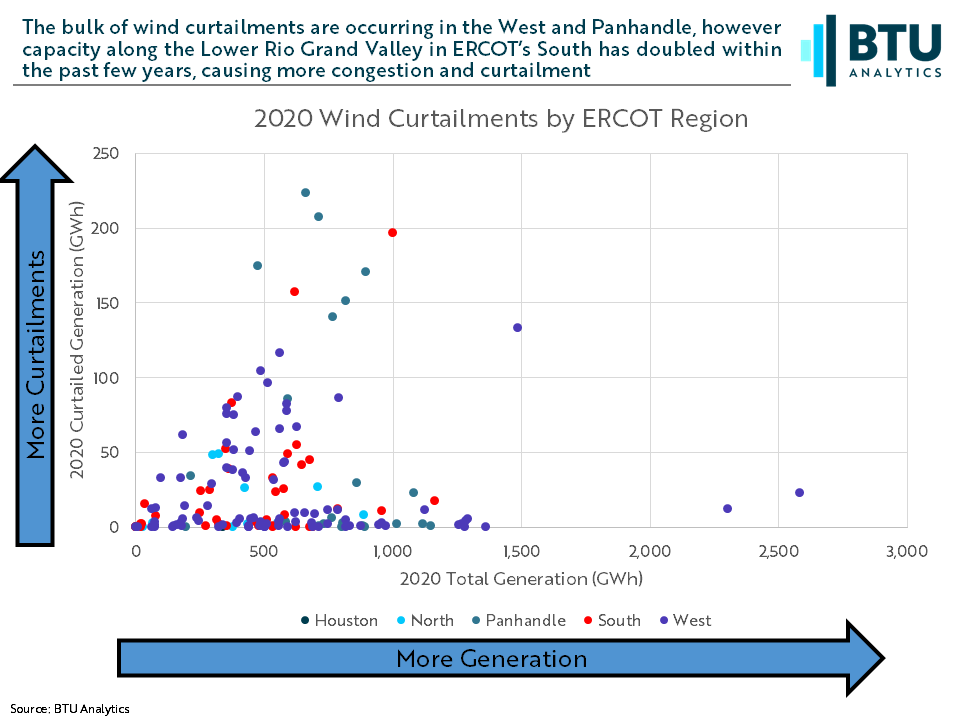
Here we can see diverging behavior around curtailments between the Panhandle and South, where a few projects make up the bulk of curtailments and the West where curtailments are more evenly spread across generators. In fact, the top 3 curtailers in the Panhandle (Astra Wind Farm, Route 66 Windfarm, and Briscoe Wind Farm) and South (Hidalgo Wind Farm, Mesteno Wind, and Palmas Altas) account for about half of all curtailments in those regions in 2020, while in the West the top 12 curtailers account for half of all curtailments.
So far, we have focused exclusively on wind generation being curtailed; however solar curtailments are on the rise as well. Solar is a relatively new entrant into the ERCOT market, accounting for just 2% of ERCOT’s generation mix in 2020, versus wind’s 19%. However, in 2020 about 10% of ERCOT solar generation was curtailed versus 5% of total wind generation. The graphic below shows curtailments for both wind and solar, and the steady ramp for both fuels.
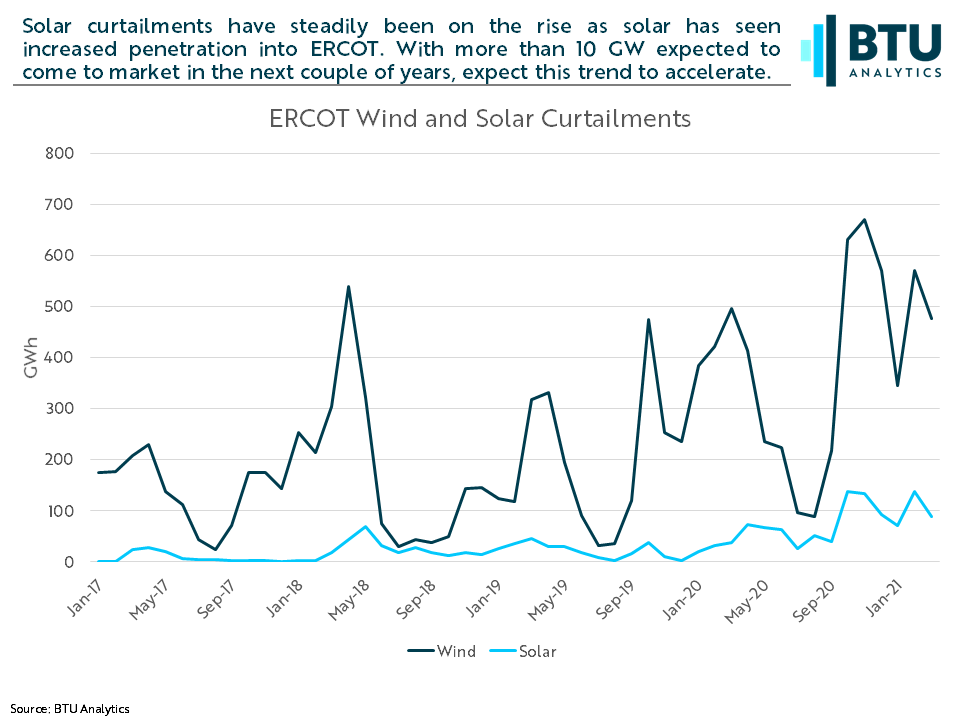
With nearly 80 GW solar (and 30 GW of wind) proposed in ERCOT, these trends will likely continue if transmission struggles to keep up. However, we will save a discussion around solar curtailments for the future. In the meantime, if you are a BTU Power View client, and would like facility level curtailment data behind this story, reach out to info@btuanalytics.com. If you are not a client, schedule a one-on-one demo of the Power View and learn how BTU can help you make sense of the power market.