As renewable energy investment continues to gain steam across the US, the impacts new wind and solar generation have on electricity pricing will only continue to grow. We have already felt these impacts take hold in regions with growing mixes of renewables. For example, areas in western ERCOT. While it stands to reason that an increase in a renewable generation would result in lower power pricing on average, a question that comes with that is the effect on the volatility of pricing. So how has new wind development affected the distribution of power pricing in ERCOT?
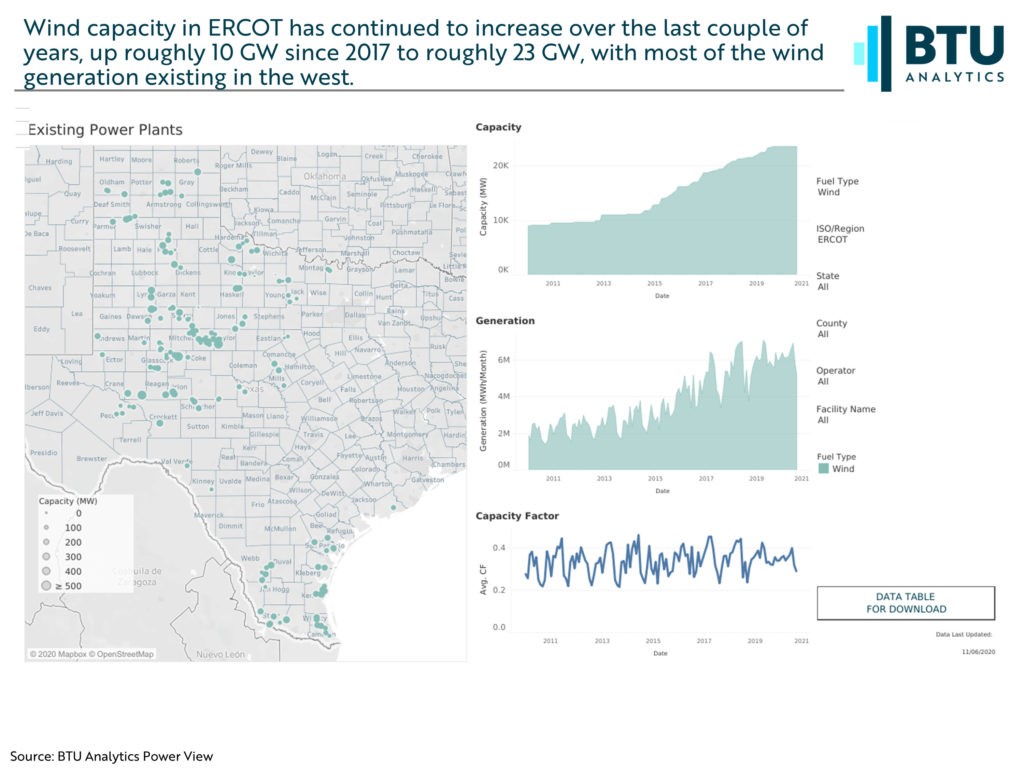
BTU Analytics has recently added historical, hourly, plant-level locational marginal pricing (LMP) across the country to its Power View platform that will help us address these questions. But first, let’s take a look at wind capacity buildout in ERCOT. The following is a screenshot from BTU’s Power View, showing operational wind projects in ERCOT, as well as the corresponding capacity, generation, and capacity factor through time in the below. These show us in the past decade ERCOT wind capacity has increased from just under 9 GW in 2010 to over 23 GW in 2020. For reference, ERCOT has 105 GW of capacity across all fuel types putting wind at 22% of capacity only behind gas at 55%. This view below makes it clear that most wind capacity is in the west (with the Lower Rio Grande Valley following behind).
Below is a screenshot of the average LMP for each plant in ERCOT from 2018 to 2020. The area names in each circle are meant to loosely define areas for the purpose of this analysis and do not necessarily comport to ERCOT definitions. First notice that there is a clear divide between ERCOT North and Houston areas, which are showing average pricing between $30-40/MW, compared to the West which is showing pricing in the $20-30/MW range.
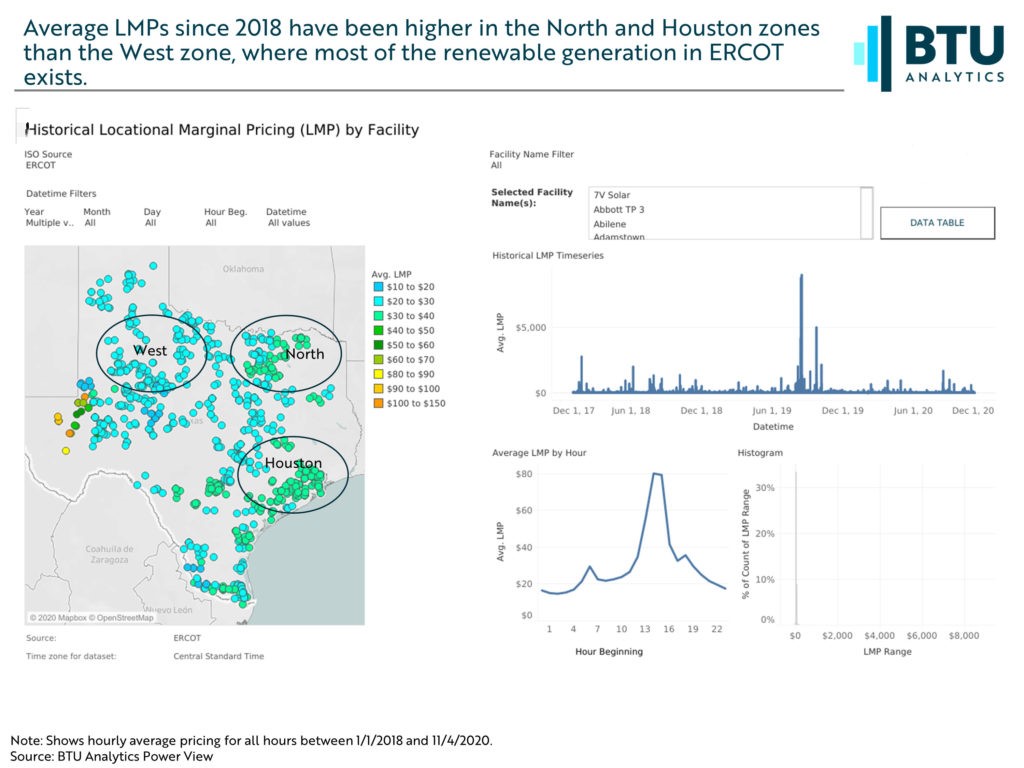
While this is not a perfect view, as hourly and seasonal pricing subtleties can’t be seen in this view, it does give some insight into how wind is likely playing into the pricing. The one exception here is the small subsection in the western Permian Basin (see our previous commentary on load from Permian oil and gas production), where transmission congestion causes drastic swings between very high and very low pricing averages.
The following graphic shows the distribution of hourly pricing for representative LMPs within the three zones circled above, since 2018.
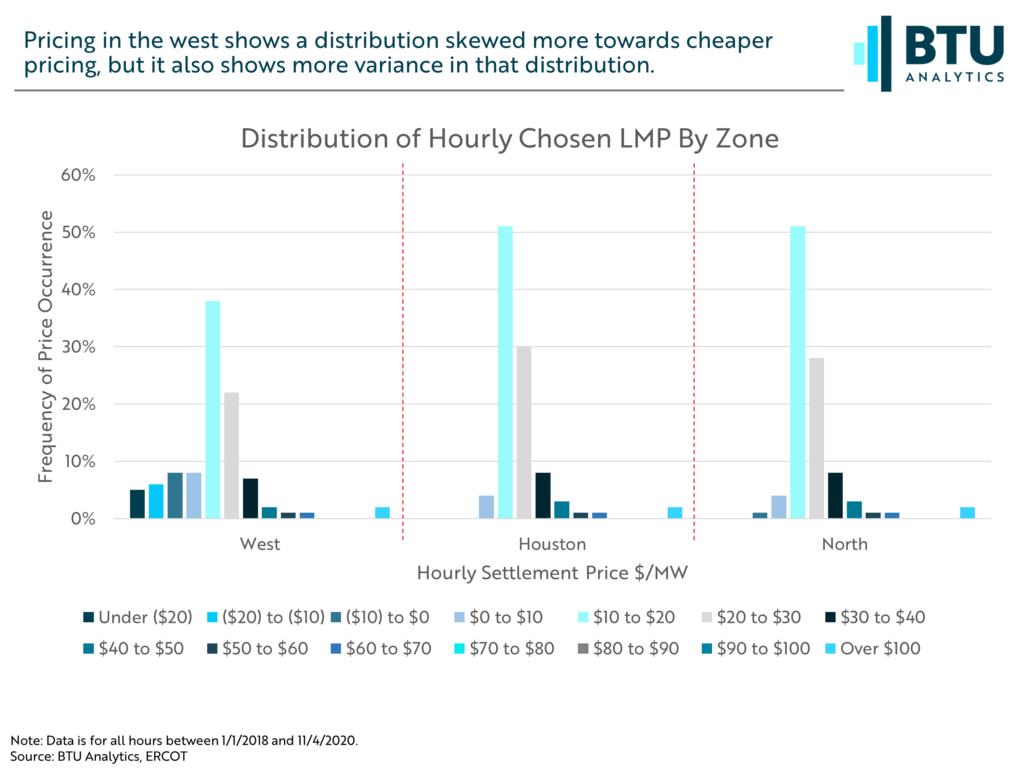
This highlights one of the challenges of renewable energy integration into the grid: pricing volatility. For pricing in the North and Houston zones, there is a relatively normal distribution centered around two buckets, $10 to $20, and the $20 to $30. In the West, increased low marginal cost renewable generation brings about a broader distribution in pricing. Covariance risk (when one wind farm generates, all generate), transmission constraints, and the effects of wind’s production tax credit help to skew prices more negative, with 19% of the pricing data points occurring below zero.
With renewable energy’s momentum only growing, expect to see pricing volatility spread as transmission systems continue to get built out and more coal and gas plants across the country retire. To see more on BTU Analytics’ power market analysis and historical LMPs, check out the Power View.