One of the signature features of the ERCOT power market is that it is an energy-only market. Unlike markets like PJM where plants can be rewarded for their capacity, whether it is used or not, ERCOT plants almost solely derive their revenue from the electrons they produce. To incentivize new plants to be built in this market structure ERCOT employs the Operating Reserve Demand Curve (ORDC). Though a complicated component with several different factors, the ORDC ultimately creates an adder to pricing. This scarcity pricing starts to kick in once demand in the system begins to eat away at reserve capacity. This then begs the question will capacity additions outpace load or will retirements help to offset new capacity coming online, creating additional volatility? Today’s energy market insight will explore this topic.
Subscribers to the BTU Power View will know that there is over 50 GW of proposed capacity that is scheduled to come online in 2021 in ERCOT. Of course, not all that capacity will actually come online, in fact BTU is tracking only about 10 GW of projects that are under construction or will begin construction shortly. Offsetting the potential capacity growth shown below, are more than 12 GW of capacity set to retire, though less than 1 GW of that is set for retirement before 2024.
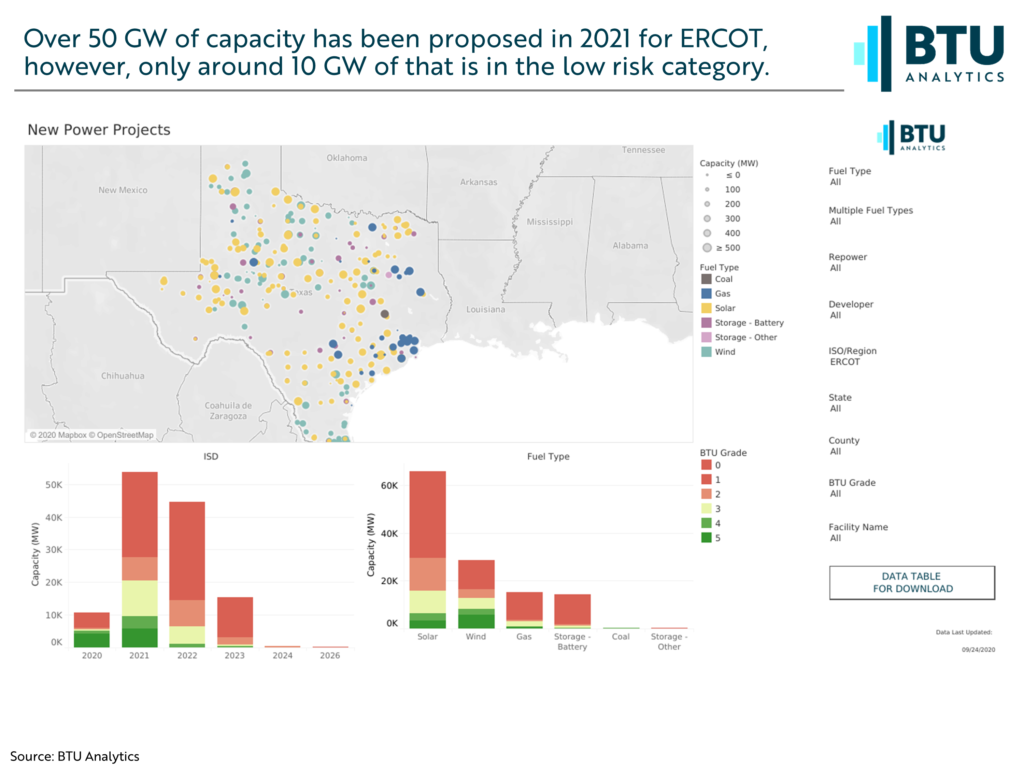
At a high level, the BTU grades here represent the risk associated with a project. A grade of 5 represents minimal risk remaining, including that it is currently under construction or slated to begin shortly. On the other end, a grade of 1 represents that the project is still a ways off, and there is the potential for regulatory setbacks, or filings have not even been initiated.
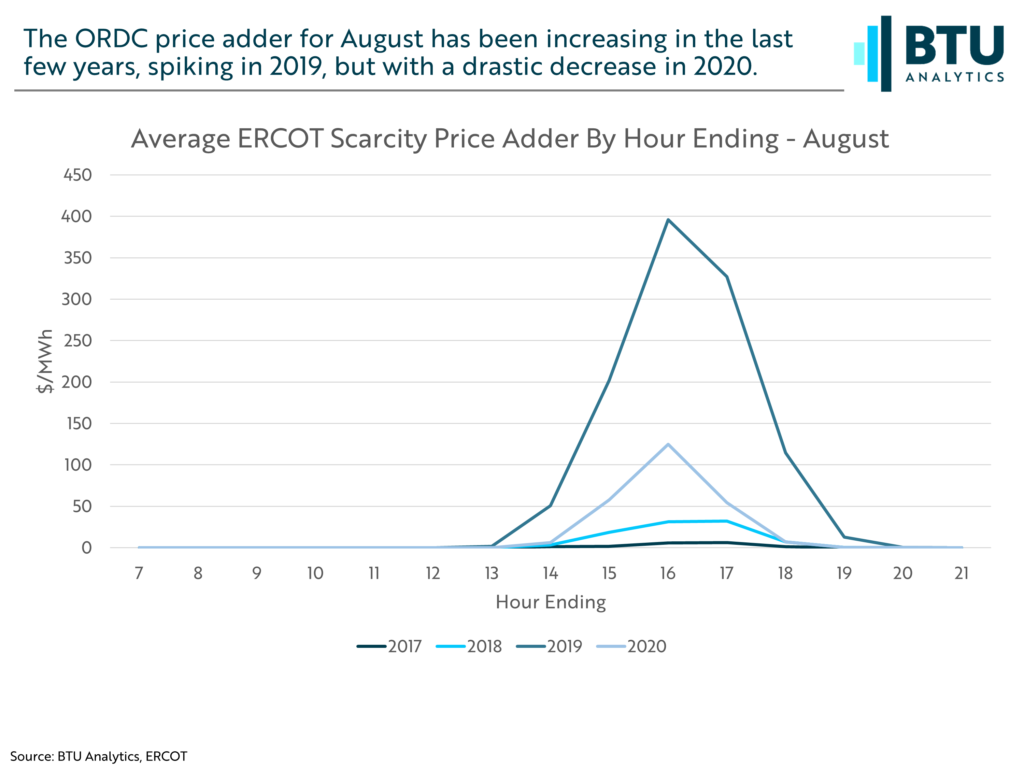
Due to the hot weather causing high levels of electricity demand, August is typically the month when we see scarcity pricing kick in. The chart below shows how the average price adder for ERCOT in August spiked in 2019, but decreased in 2020. Two main things could attribute to this; increased reserve capacity, or a decrease in load.
The likely culprit in this case is a year-over-year drop in load, driven by milder summer temperatures and the impacts of COVID-19. The graphic below shows average August hourly load over the past few years. Previously, we discussed Permian activity as a major driver in ERCOT load growth. Here however, average load fell from peaks seen in 2019 to this year.
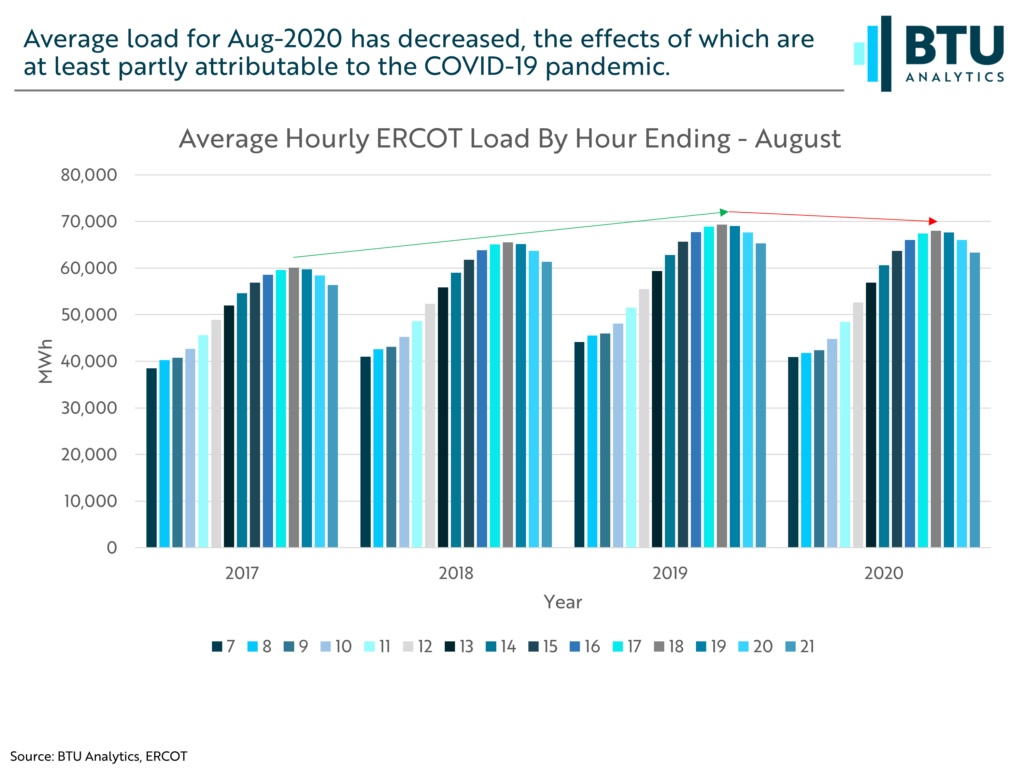
This again could be attributed to several different things, though the COVID-19 pandemic is likely a factor. In May ERCOT had adjusted their peak load forecast down to 75,200 MW, a 1,496 WM decrease, citing COVID-19, however call for continuing peak load growth over the next few years.
With retiring thermal generation contributing more to the reserve margin than wind and solar projects, which make up the vast majority of proposed projects, timing of these retirements and additions will be crucial in determining whether or not pricing volatility will continue.
Interested in the ERCOT market? Request a one-on-one discussion of BTU’s outlook on ERCOT capacity, generation, and pricing at info@btuanalytics.com, using the subject line “ERCOT Outlook”.