Power burn remains a key component of natural gas demand and in past Energy Market Insights we have looked at power burn by region and by state, but today we will look at it by pipeline. BTU Analytics recently launched the Power View product to make looking for answers in the ever-evolving power markets a quick and easy task. Over the last 20 years, natural gas power plant development was driven first by the speculative power plant boom in the early 2000s. This boom was then followed by development of natural gas fired power plants in close proximity to low cost shale gas supplies. In today’s Energy Market Commentary, we will look at how much gas power plant development has occurred and which pipes have been the biggest beneficiaries of power plant capacity and generation growth.
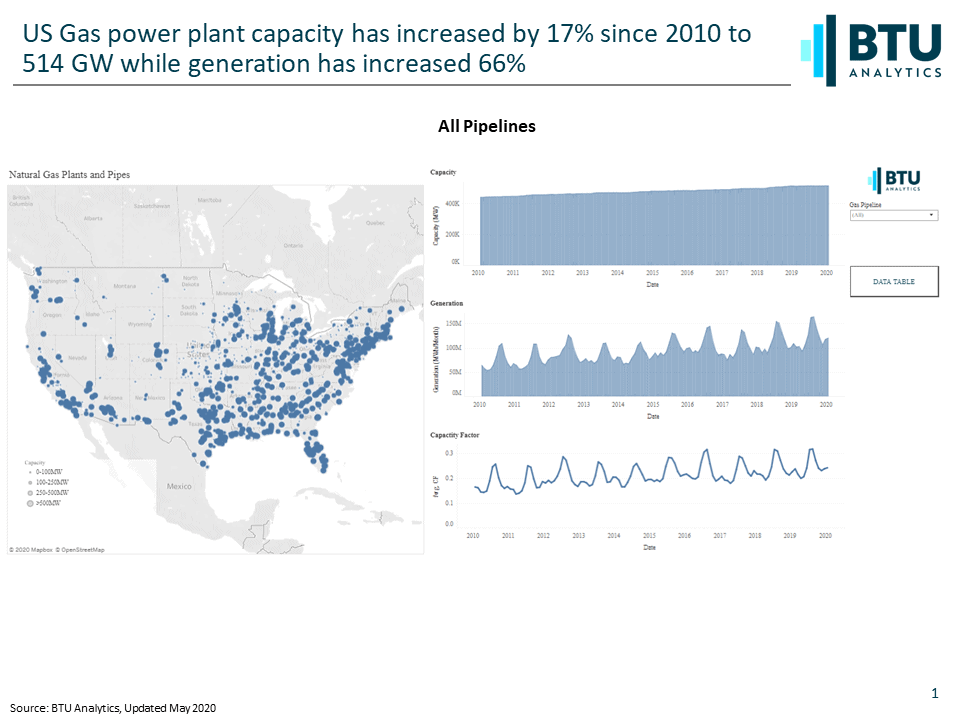
As shown above, US gas power plant capacity has increased by 17% since 2010. The combination of low natural gas prices driving coal displacement and new high efficiency gas plants has resulted in natural gas fired generation increasing by 66% over the same time frame. The charts above are from BTU Analytics’ Power View platform. This platform allows a user to view all natural gas plants in the US as well as filter natural gas plants based on the natural gas pipeline serving the power plant.
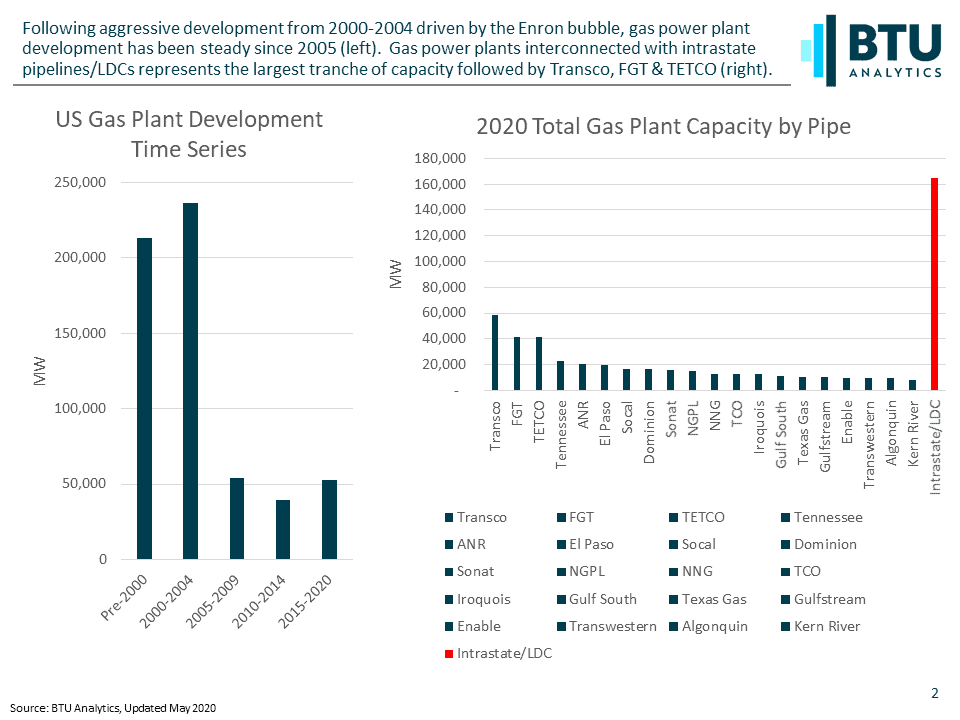
The time series above shows gas power plant development in five-year increments and shows the boom in 2000-2004 when gas plant capacity more than doubled thanks to low gas prices and widespread development by Enron, Duke, El Paso and Dynegy – top left. What followed was consistent development from 2005 through 2020 driven by low cost shale gas. One recurring theme has been gas plant development in supply areas proximate to large sources of electric load. The Marcellus in Appalachia was well positioned and advantaged Appalachian connected pipelines. Using BTU’s Power View data extract, we can see the chart above right shows the 20 pipelines sorted by total gas plant capacity in 2020 with Marcellus connected pipes of Transco, TETCO, Tennessee, ANR and Dominion rounding out the top ten. Note in BTU’s Power View gas plants that are interconnected to intrastate pipelines and LDCs are grouped together and represent the largest tranche of capacity.
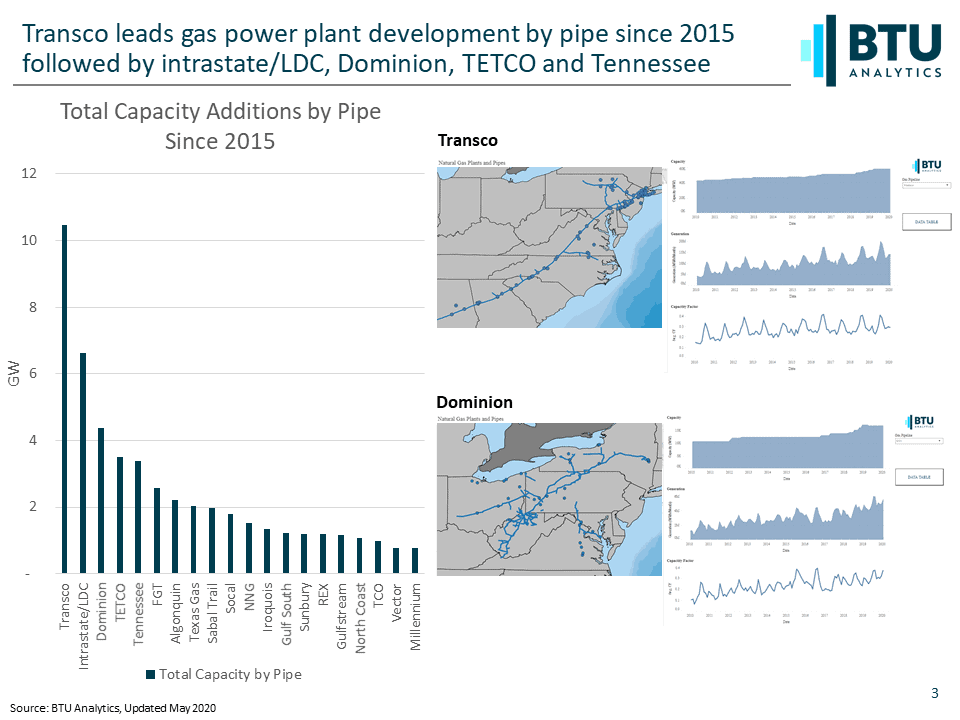
The impact of the Marcellus and proximity to major sources of power load can be seen further when looking at the incremental total capacity increases by pipe from 2015 to 2020. Again, Transco takes the top spot but other Marcellus connected pipes in the top five spots include Dominion, TETCO and Tennessee – as shown above top left. Using the BTU Power View – above right – by selecting Transco and Dominion individually we can quickly see that capacity increased by 22% and 37% respectively and generation increased by 36% and 41% respectively on each pipe. To learn more about the BTU Analytics’ Power View platform request more information here or email: info@btuanalytics.com subject BTU Power View