Last week BTU hosted a complimentary webinar on midstream opportunities presented by the proliferation of renewables generation and the introduction of green hydrogen. While still in its early stages, BTU is tracking eleven power plants around the US that have announced they plan to use a hydrogen/natural gas blend or pure hydrogen, and given the ESG movement’s momentum, we are likely to see more. This creates opportunities for pipelines to help transport a carbon-free fuel and help off-takers meet climate and emissions goals. Today’s Energy Market Insight will provide a brief recap of some of the key points hit on during the webinar on what makes a viable green hydrogen opportunity.
If you weren’t able to attend, you can still watch a replay of Green Hydrogen and Renewables: Creating Opportunity for Natural Gas Pipelines. If you are a BTU client, in addition to the replay above, you can request a copy of the deck by emailing info@btuanalytics.com with the subject line: “Hydrogen Webinar Deck”.
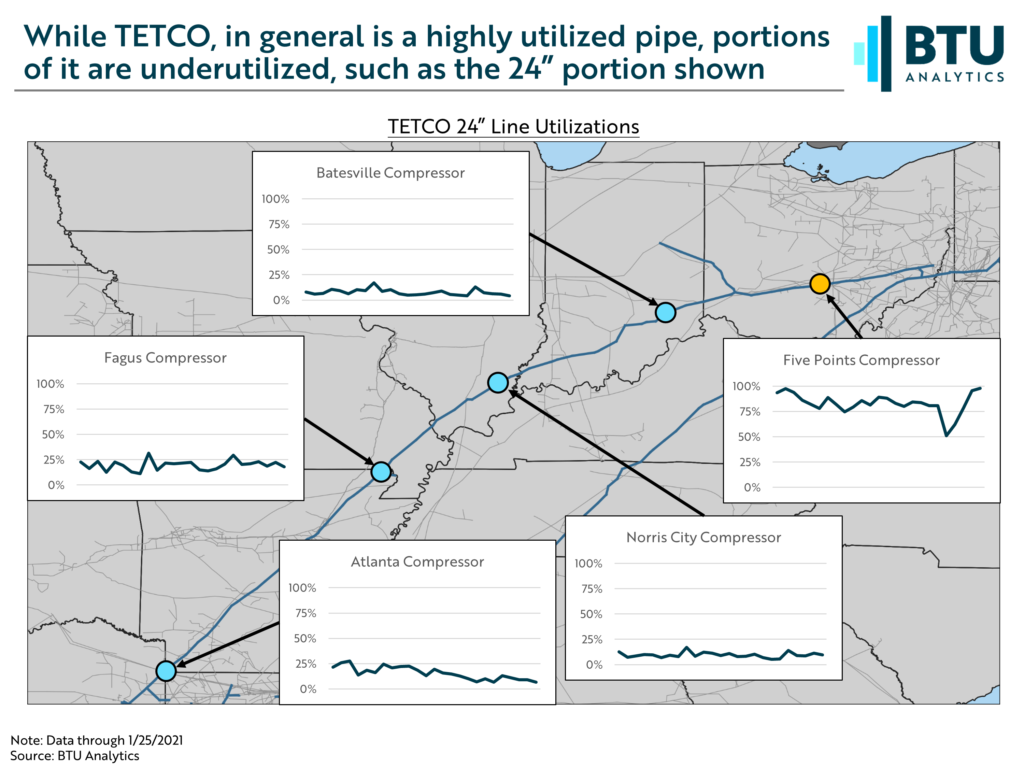
For the discussion, we used TETCO’s underutilized 24” segment and NNG’s Field Zone in West Texas to highlight four aspects of a green hydrogen investments along pipeline footprints: existing, proposed, or potential renewables development, ability to transport on underutilized segments of natural gas pipelines, potential end user demand, and access to low power prices. TETCO’s 24” segment, which has about 200 MMcf/d of open capacity, is still configured to move gas south-to-north while other segments of the pipe and other pipes that cover a similar geographic footprint now move Marcellus and Utica gas north-to-south. This provides room for potential blending of natural gas and green hydrogen.
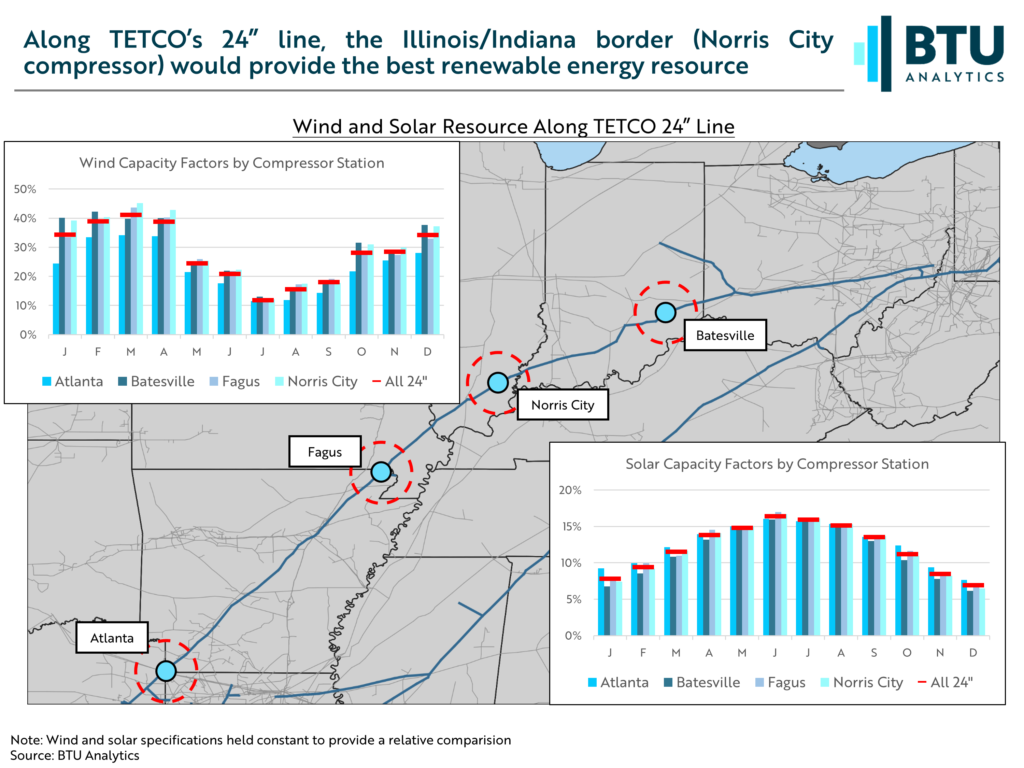
For potential production of green hydrogen, you also need to understand the quality of renewable resources (wind speeds, solar irradiance, etc) along a footprint. To do this, BTU simulated generation from potential wind and solar plants along TETCO’s footprint. This can then be converted to a plant’s capacity factor, which is a measure of expected generation from a plant. The following slide shows these capacity factors for simulated wind (top left graphic) and solar (bottom right graphic) projects near the highlighted compressor stations. While TETCO lies outside of the US’ core wind and solar areas, southern Illinois near the Norris City compressor, outperforms in regard to wind generation compared to other points along this segment of pipe.
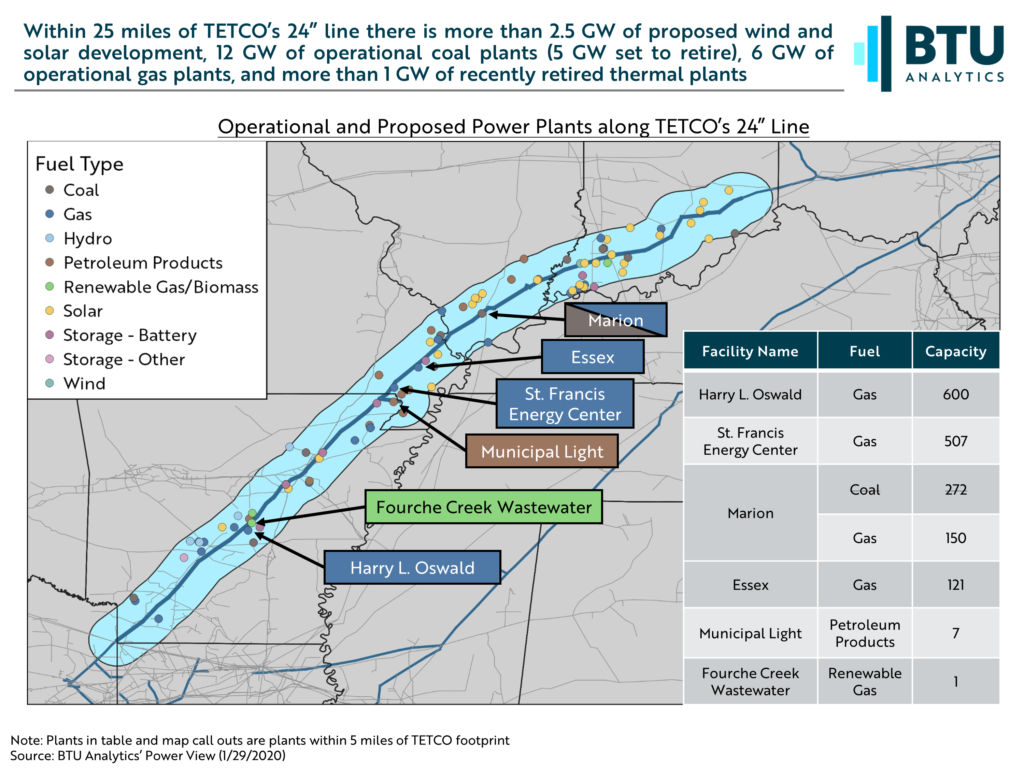
For potential blended hydrogen off takers, we pulled power plant data from BTU’s Power View in relation to TETCO’s footprint. The following map shows existing and proposed plants within 25 miles of TETCO with the callouts and table showing plants within 5 miles. These plants represent potential off takers for blended hydrogen/natural gas along this segment of pipe.
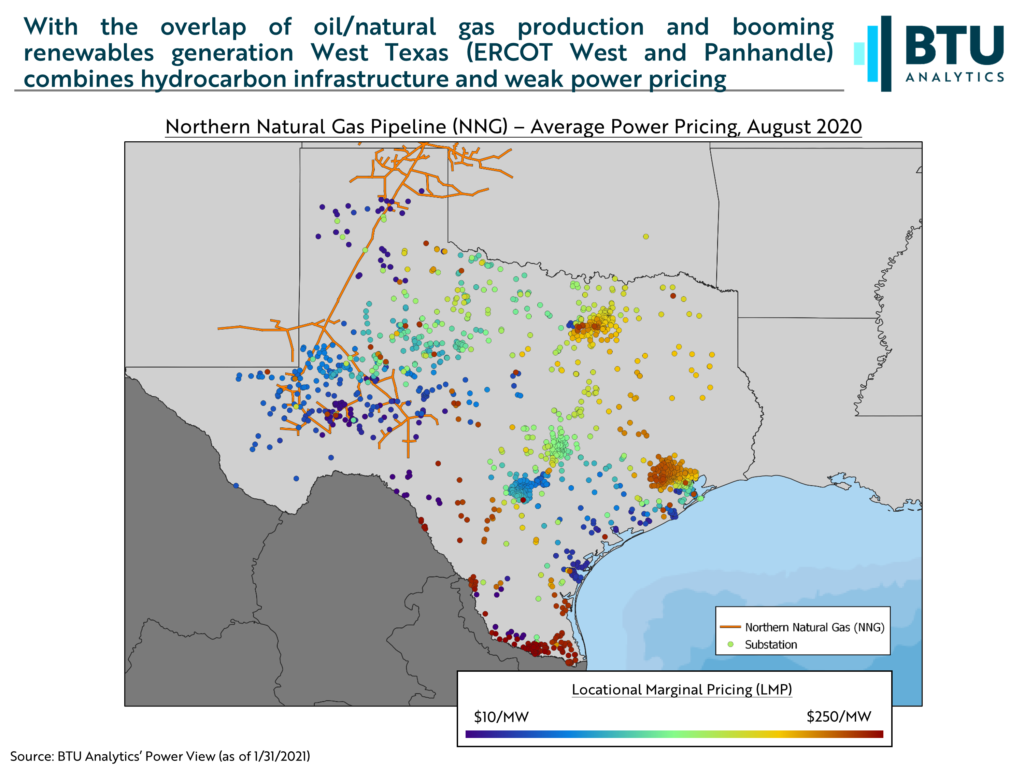
Finally, we discussed low power pricing in relation to pipeline footprints. For this, we analyzed NNG pipeline and western ERCOT. In western ERCOT, the buildout of wind and solar capacity has had ramifications to both average price levels and volatility. The following map shows NNG’s footprint with ERCOT substations represented by the dots and colored by their locational marginal price (LMP). Weak prices not only lend to siting of a potential electrolyzer for hydrogen production but also for potential electrification of compressor stations.
There are certainly obstacles to widespread natural gas/hydrogen blending. However, power plants and industrial users will increasingly look for ways to reduce emissions to meet state, local, or self-imposed mandates. Pipelines can play an integral role in the pursuit of those goals. To learn more about identifying new opportunities in the market today, listen to a replay of our complimentary webinar or reach out to info@btuanalytics.com to set up a call with BTU’s Power and Natural Gas teams.