Fears of an impending energy shortage this winter have led to some of the strongest energy commodity prices in years with WTI exceeding $80/Bbl and Henry Hub over $5.50/MMBtu. While growth in US renewables won’t be able to relieve the energy shortage this winter, an energy crisis could accelerate a transition to green energy sources leading to long-term demand destruction for domestic gas generation. New investment in renewables would build on what has already been a substantial increase in proposed solar projects in the past year. Using BTU Analytics’ Power View, today’s Insight examines new solar project announcements and their potential impact on US natural gas demand.
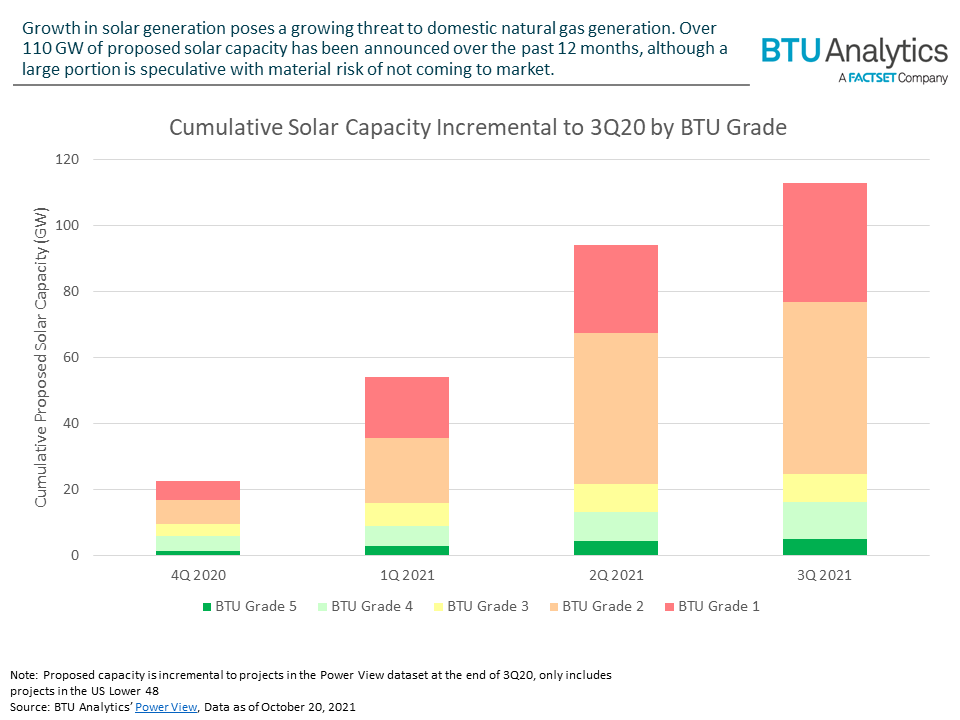
BTU Analytics’ Power View service tracks new generation capacity announcements and assigns a BTU Grade to quantify the risk a project will come to market. Over the past four quarters, 113 GW of new solar capacity has been announced, bringing total planned solar capacity to just under 300 GW (incremental to already operational solar capacity). However, a large portion of that proposed capacity is speculative with little chance of making it to market. Limiting capacity announcements to just projects with a BTU Grade of 3 and above (those assessed as more likely to come to market), approximately 25 GW of new solar capacity has been added to the project list over the last 12 months.
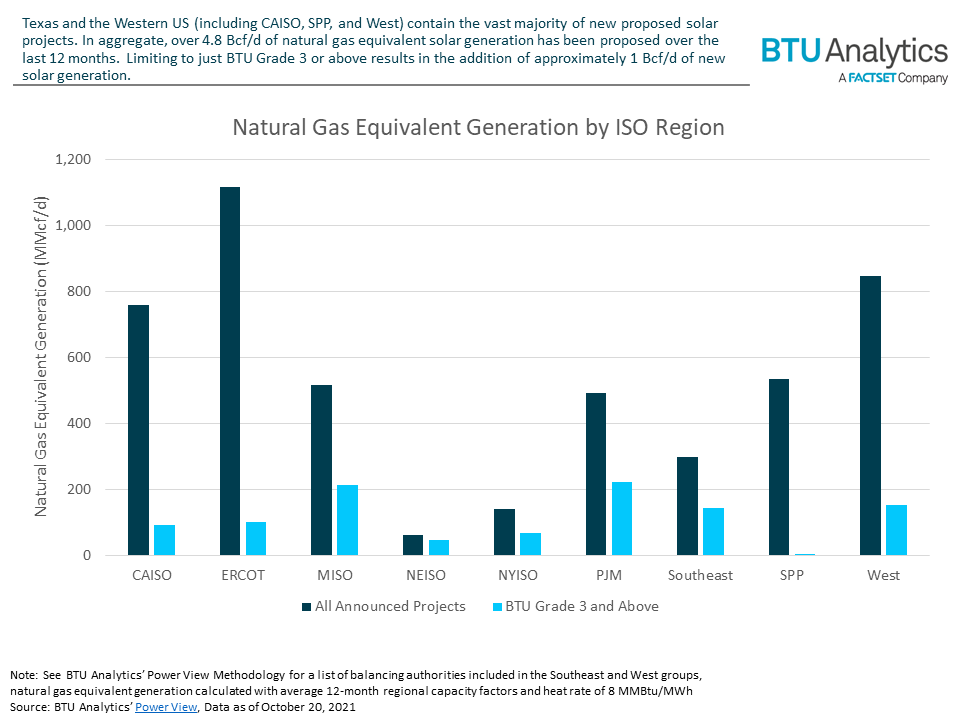
Perhaps unsurprisingly, Texas and the Western US make up the vast majority of recent solar project announcements. Not only do these regions generally have higher average capacity factors than the rest of the US, but they also have the most open land allowing for larger proposed projects. However, when limiting projects to those with the least risk, the Midwest and Northeast have seen the largest increases in proposed capacity over the last year.
Using the average 12-month capacity factor for each ISO region, the increases in proposed solar capacity can be converted to natural gas equivalent generation to estimate the impact on domestic gas generation. Since the end of 3Q20, approximately 1 Bcf/d of new solar capacity with a BTU Grade of 3 or above has been added to the BTU Analytics’ project list. If expanded to include all speculative projects, that number balloons to 4.9 Bcf/d of incremental solar generation. While 4.9 Bcf/d is unrealistic, 1 Bcf/d of new solar capacity represents a 27% increase in solar capacity that could come online by the end of 2026.
As renewables continue to grow, the impact of renewables in the generation mix and on domestic natural gas demand will be increasingly important. You can explore new projects, retirements, energy storage, and more by requesting a demonstration of BTU Analytics’ Power View. For more on how solar buildout impacts US gas demand, storage, and natural gas pricing, request a sample of the Henry Hub Outlook.