The growth in solar generation continues to be one of the largest points of interest amongst those involved in power markets. In generation queues across the country, solar makes up by far the largest amount of any fuel type, with just under 250 GW of capacity in the queue. Although not all of this capacity has an equal chance of being built out (to see the breakdown of risk for projects by fuel type across the country, check out the BTU Power View). For comparison, the next highest fuel type (wind) has proposals of just under 150 GW. Logically, much of this solar is being built in sun-rich parts of the county (such as California, Texas, and the southeast), but the question arises of how the sun as a resource varies from one location to the next. Do we see material shifts in resource in a smaller geographic area? Today we will answer this question by looking at ERCOT.
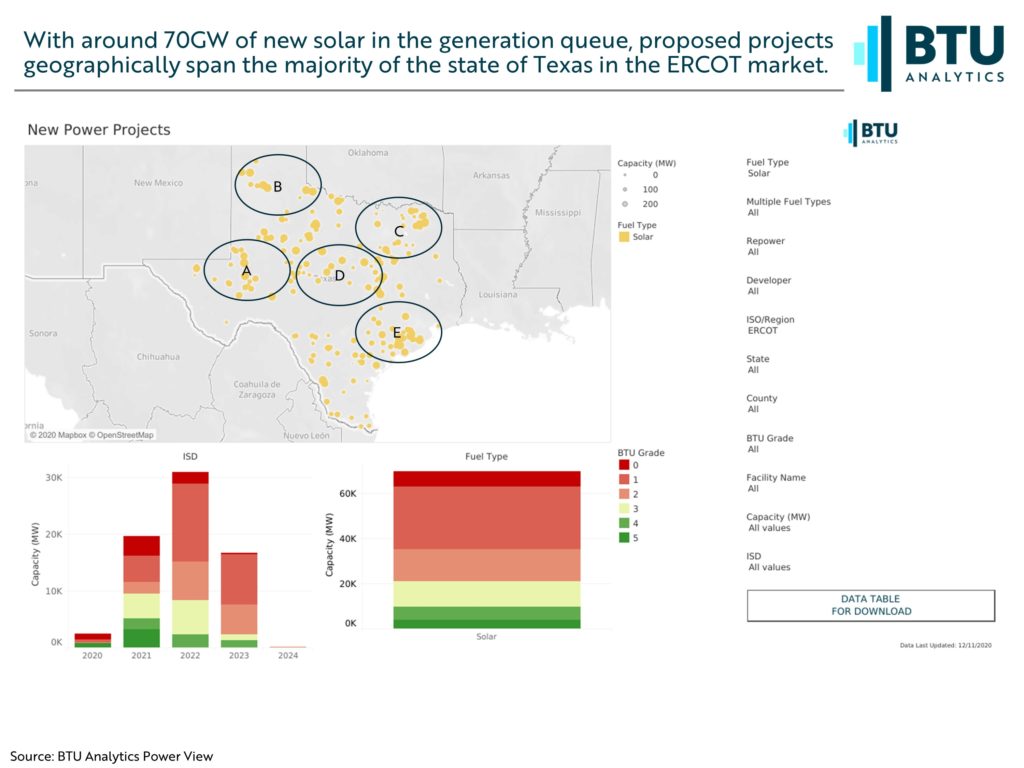
The below graphic shows the capacity of solar generation that has been proposed in ERCOT, as seen in the BTU Power View. There are some pockets of larger solar development that begin to appear, but for the most part, there are proposals across the majority of Texas. But how does generation potential change across the state of Texas? To look at this, we will break out the solar development into some smaller regions, as marked in the below graphic.
Since we are interested in how the sun as a resource acts across the state, we want to simulate a new solar generator for a years’ worth of data, controlling for other factors which could heavily influence solar generation such as axis tracking and film types. The results of the model can be seen below.
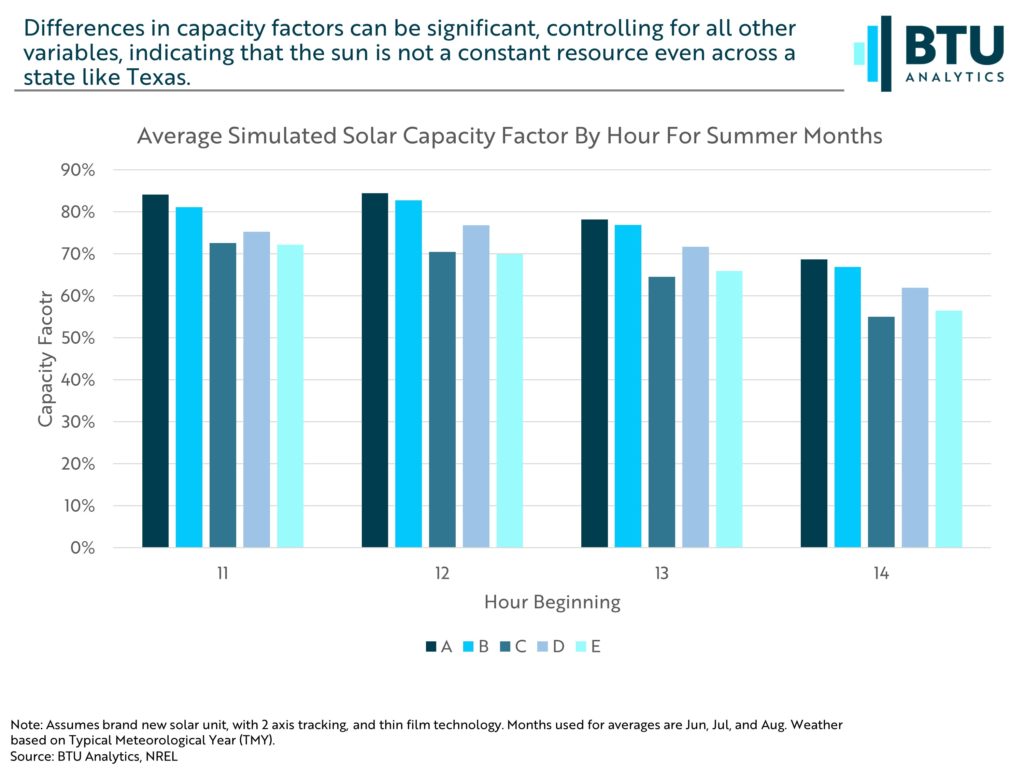
For the summer months of June, July, and August, and between the hours of 11:00 to 14:00 (peak solar generation), it becomes apparent that even within a single state, the sun doesn’t shine equally across the board. This is further shown in the below map, which shows a simulation at each proposed solar project’s location (note again, this controls for different solar generator types, and is only showing the effects of solar resources, not what the generation profile will look like for a specific project).
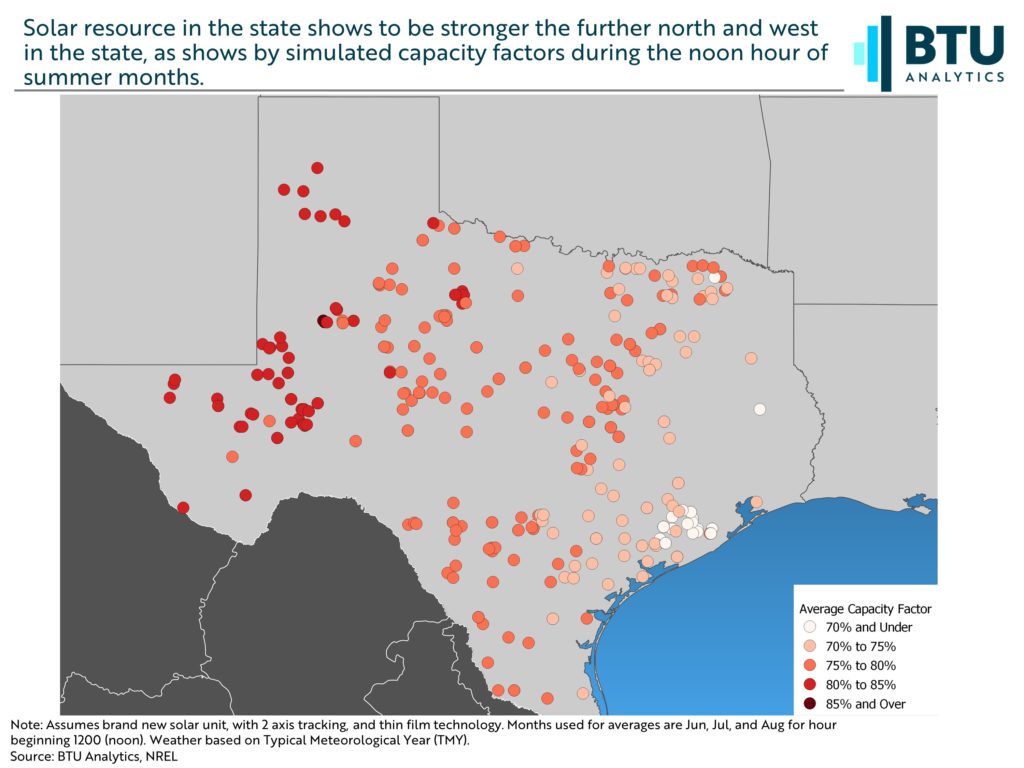
The more western regions, which were earlier denoted with zones A and B, show a significantly higher average capacity factor during those summer months than other zones. This would indicate solar resource is more prevalent in the western parts of the state and moves progressively lower as you move east. Intuitively, this makes sense, knowing that most operational solar in ERCOT is in the West.
One other detail around this is how load is spread across these regions of ERCOT. Load in the North, Houston, and South zones (denoted in this analysis more roughly as zones C, D, and E) makes up a far greater share of ERCOT load than do the West and Panhandle. This becomes meaningful because in a market where greater supply potential exists in a geographically different location than where much of the demand is, it opens the door to opportunities for things like transmission and storage, both of which will continue to play an important role across power markets. BTU’s Power View platform continuously tracks and analyzes all power development and existing power assets across the United States.