In a previous piece on siting new solar projects, we discussed how solar resources varied across ERCOT. Interesting patterns emerged from that, and it could be seen that moving from the east to the west part of the state resulted in a higher projected peak capacity factor for solar projects. So how does the same analysis hold when looking at wind?
But before we dive in, BTU will be hosting a complimentary webinar about how green hydrogen, the power markets, and natural gas infrastructure are converging. Join us February 2, 2021, for Green Hydrogen and Renewables: Creating Opportunity for Natural Gas Pipelines.
To start off, here is a snapshot from the BTU Power View, which shows the wind projects in the generation queue across ERCOT. While there is less capacity in the generation queue for wind than there is solar, there is also more existing wind capacity in ERCOT. Looking at where the new projects are proposed shows that the geographic variability of wind projects is much lower than that for solar projects.
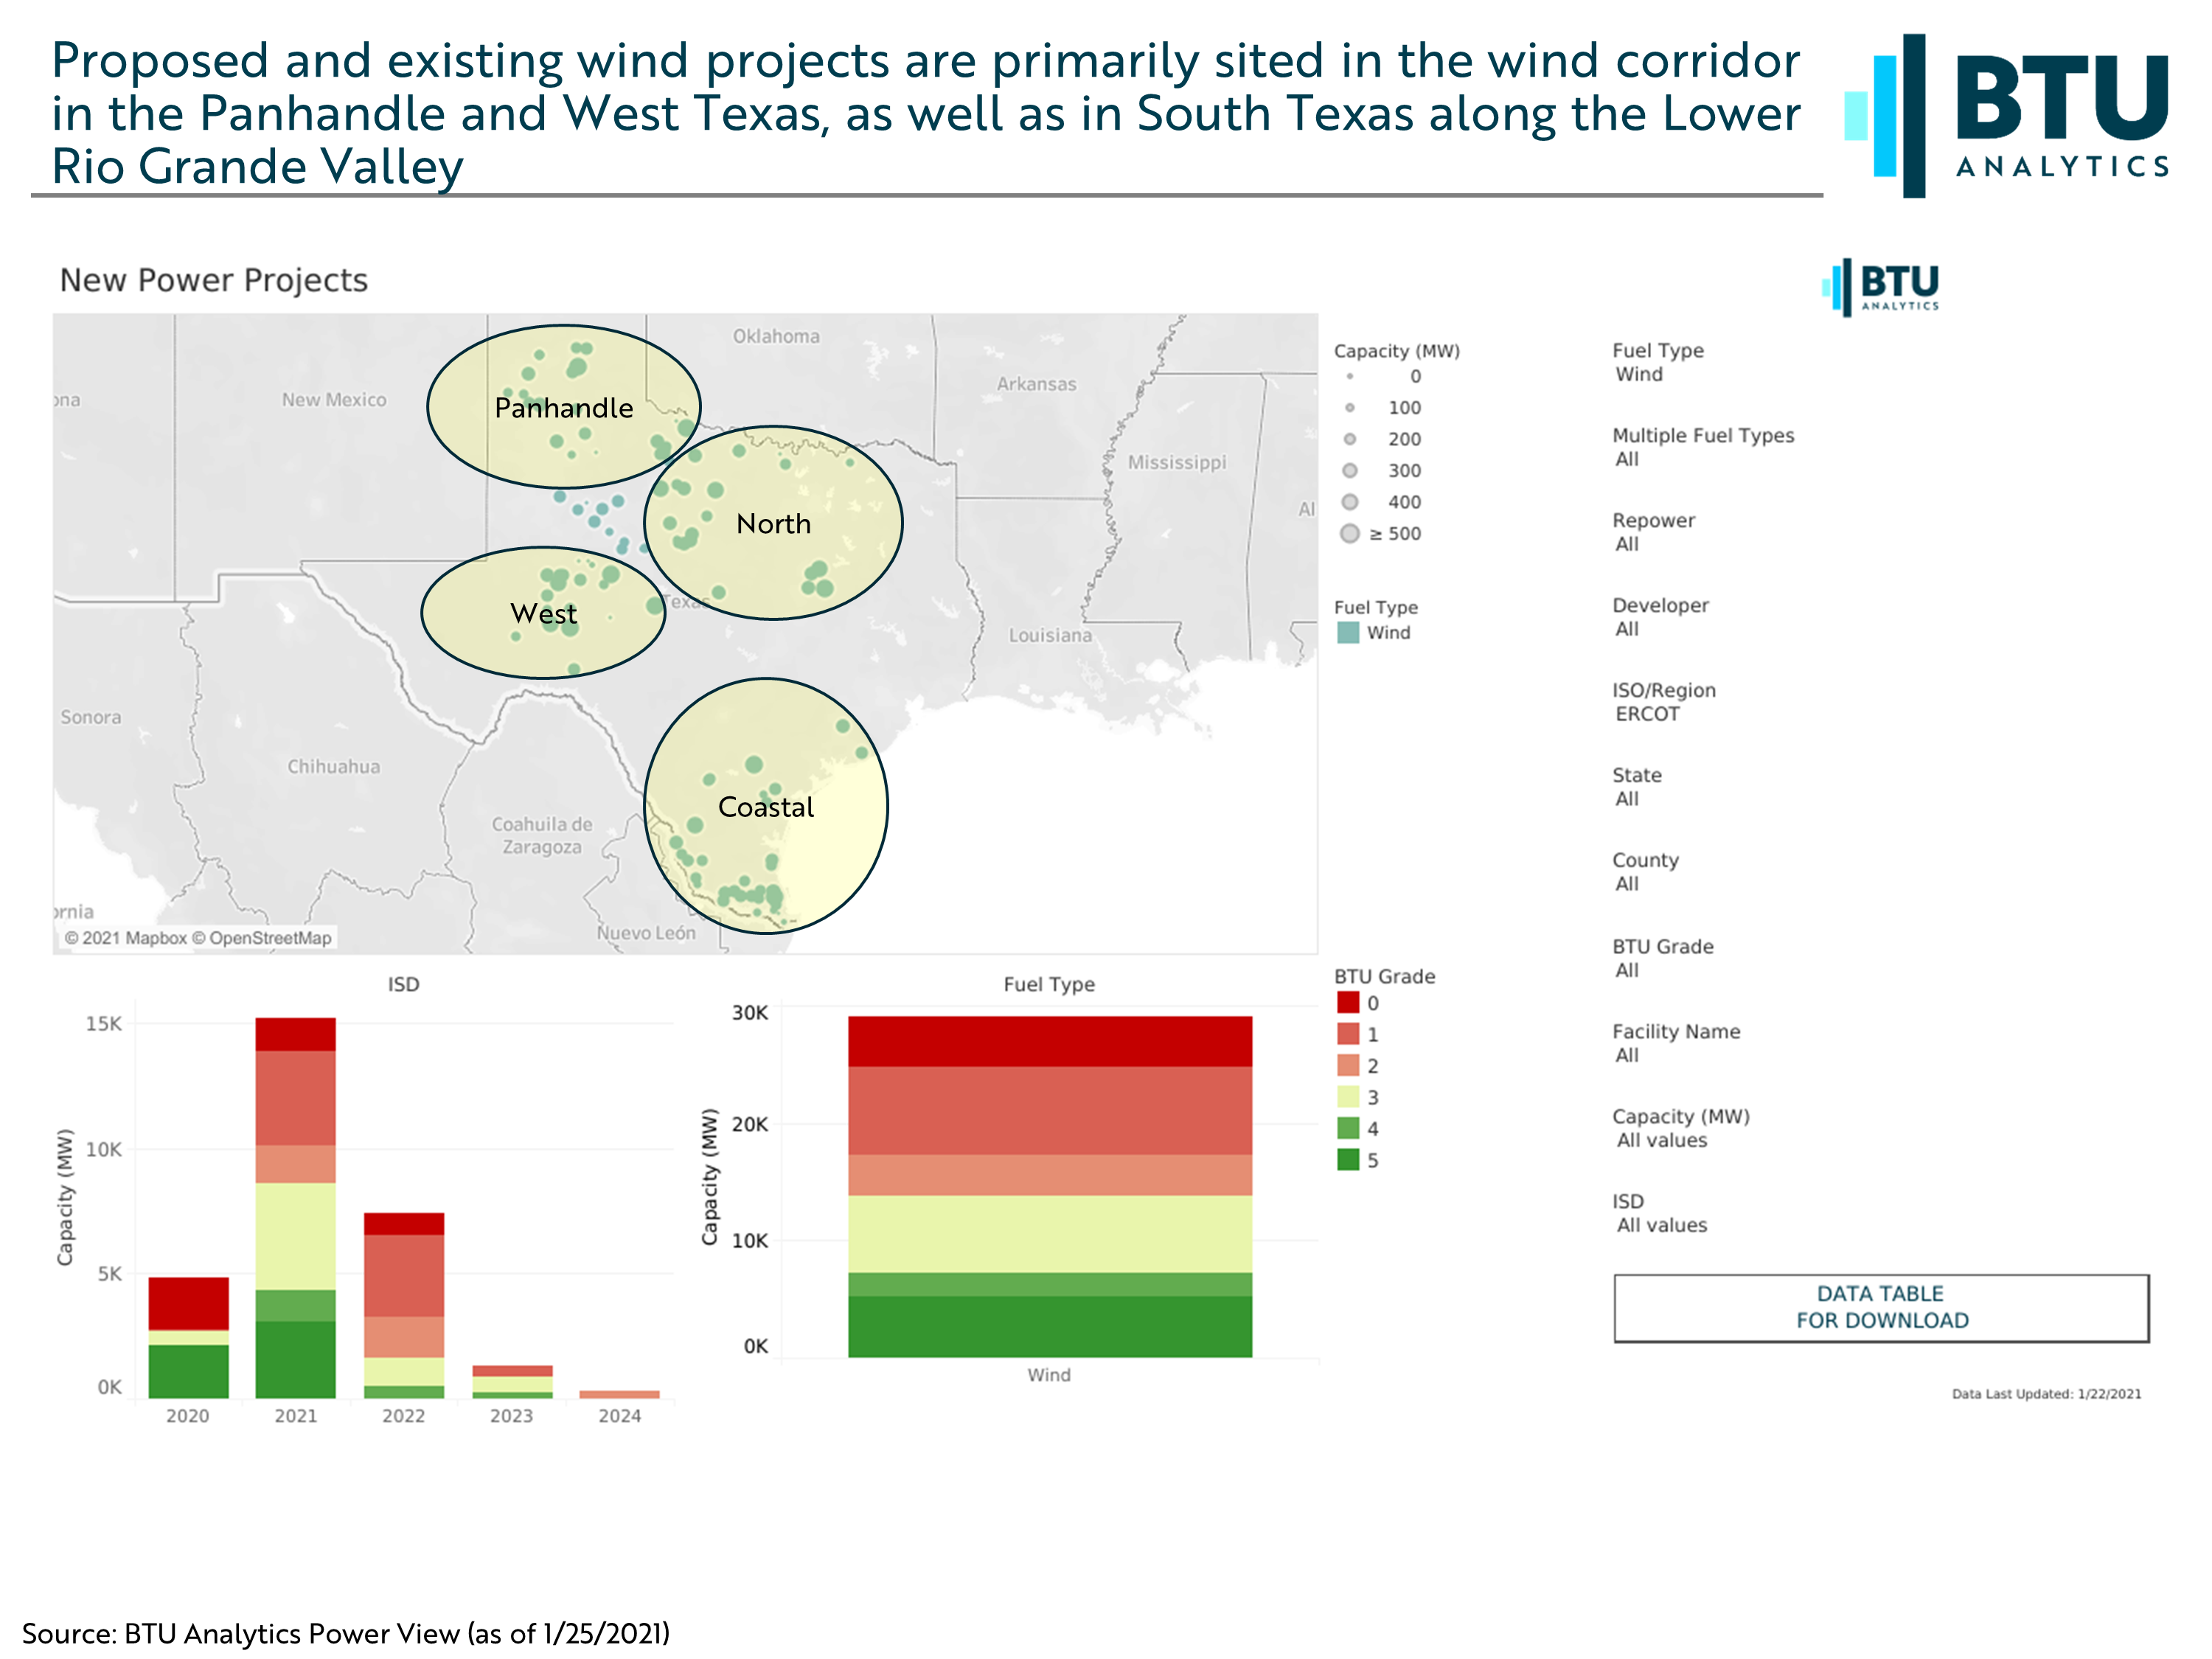
We have roughly divided the projects into four zones: Panhandle, North, West, and Coastal. These loosely tie to ERCOT zones, however for this analysis only they do not adhere strictly to ERCOT’s definitions. Looking at average capacity factors over a one-year simulation (at a hub height of 80m, on a new generic turbine) the variability over the year and between these four rough zones can be seen.
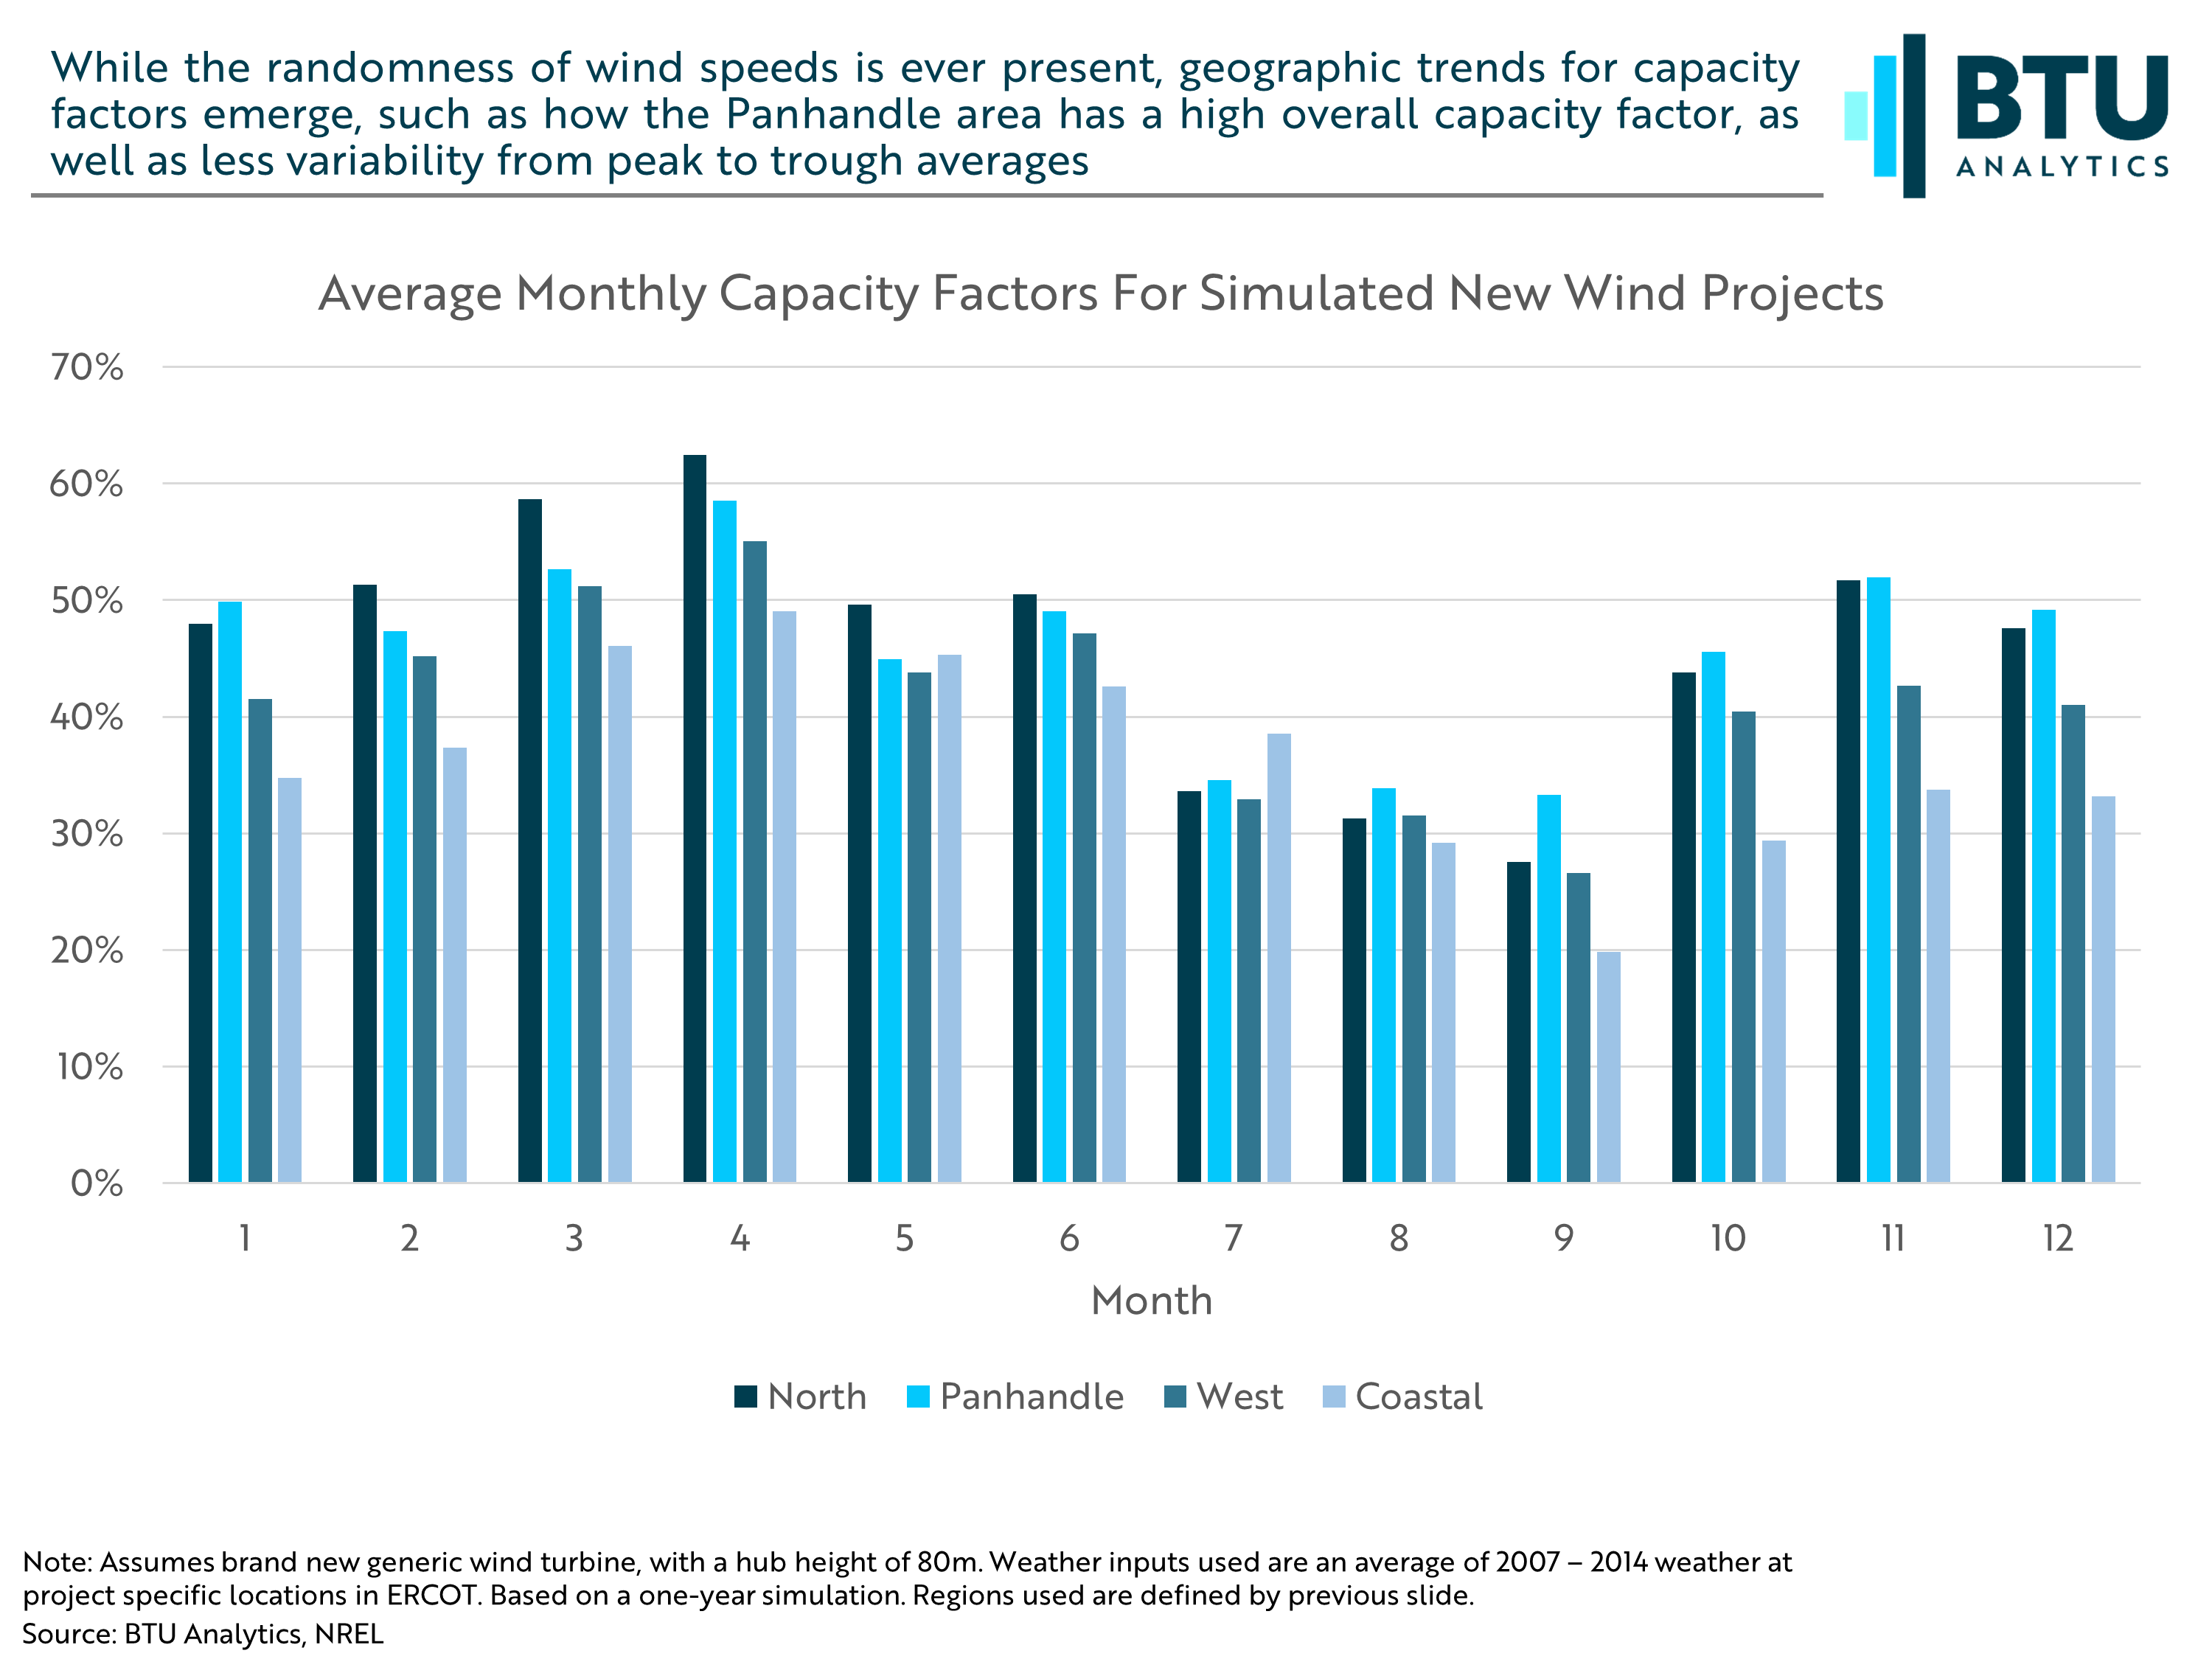
While the North zone has the highest peak utilizations, it also has the highest variability of all the zones. In fact, both the North and Panhandle zones average annually to about 46% utilization, however Panhandle shows much less variability. The peak-to-trough change for each of these zones over the one-year simulation was 35% for North, 25% for Panhandle, 28% for West, and 29% for Coastal. However, it is important to note these are averages over a simulation. The following map helps to illustrate how different wind as a resource can be even when locations are nearby.
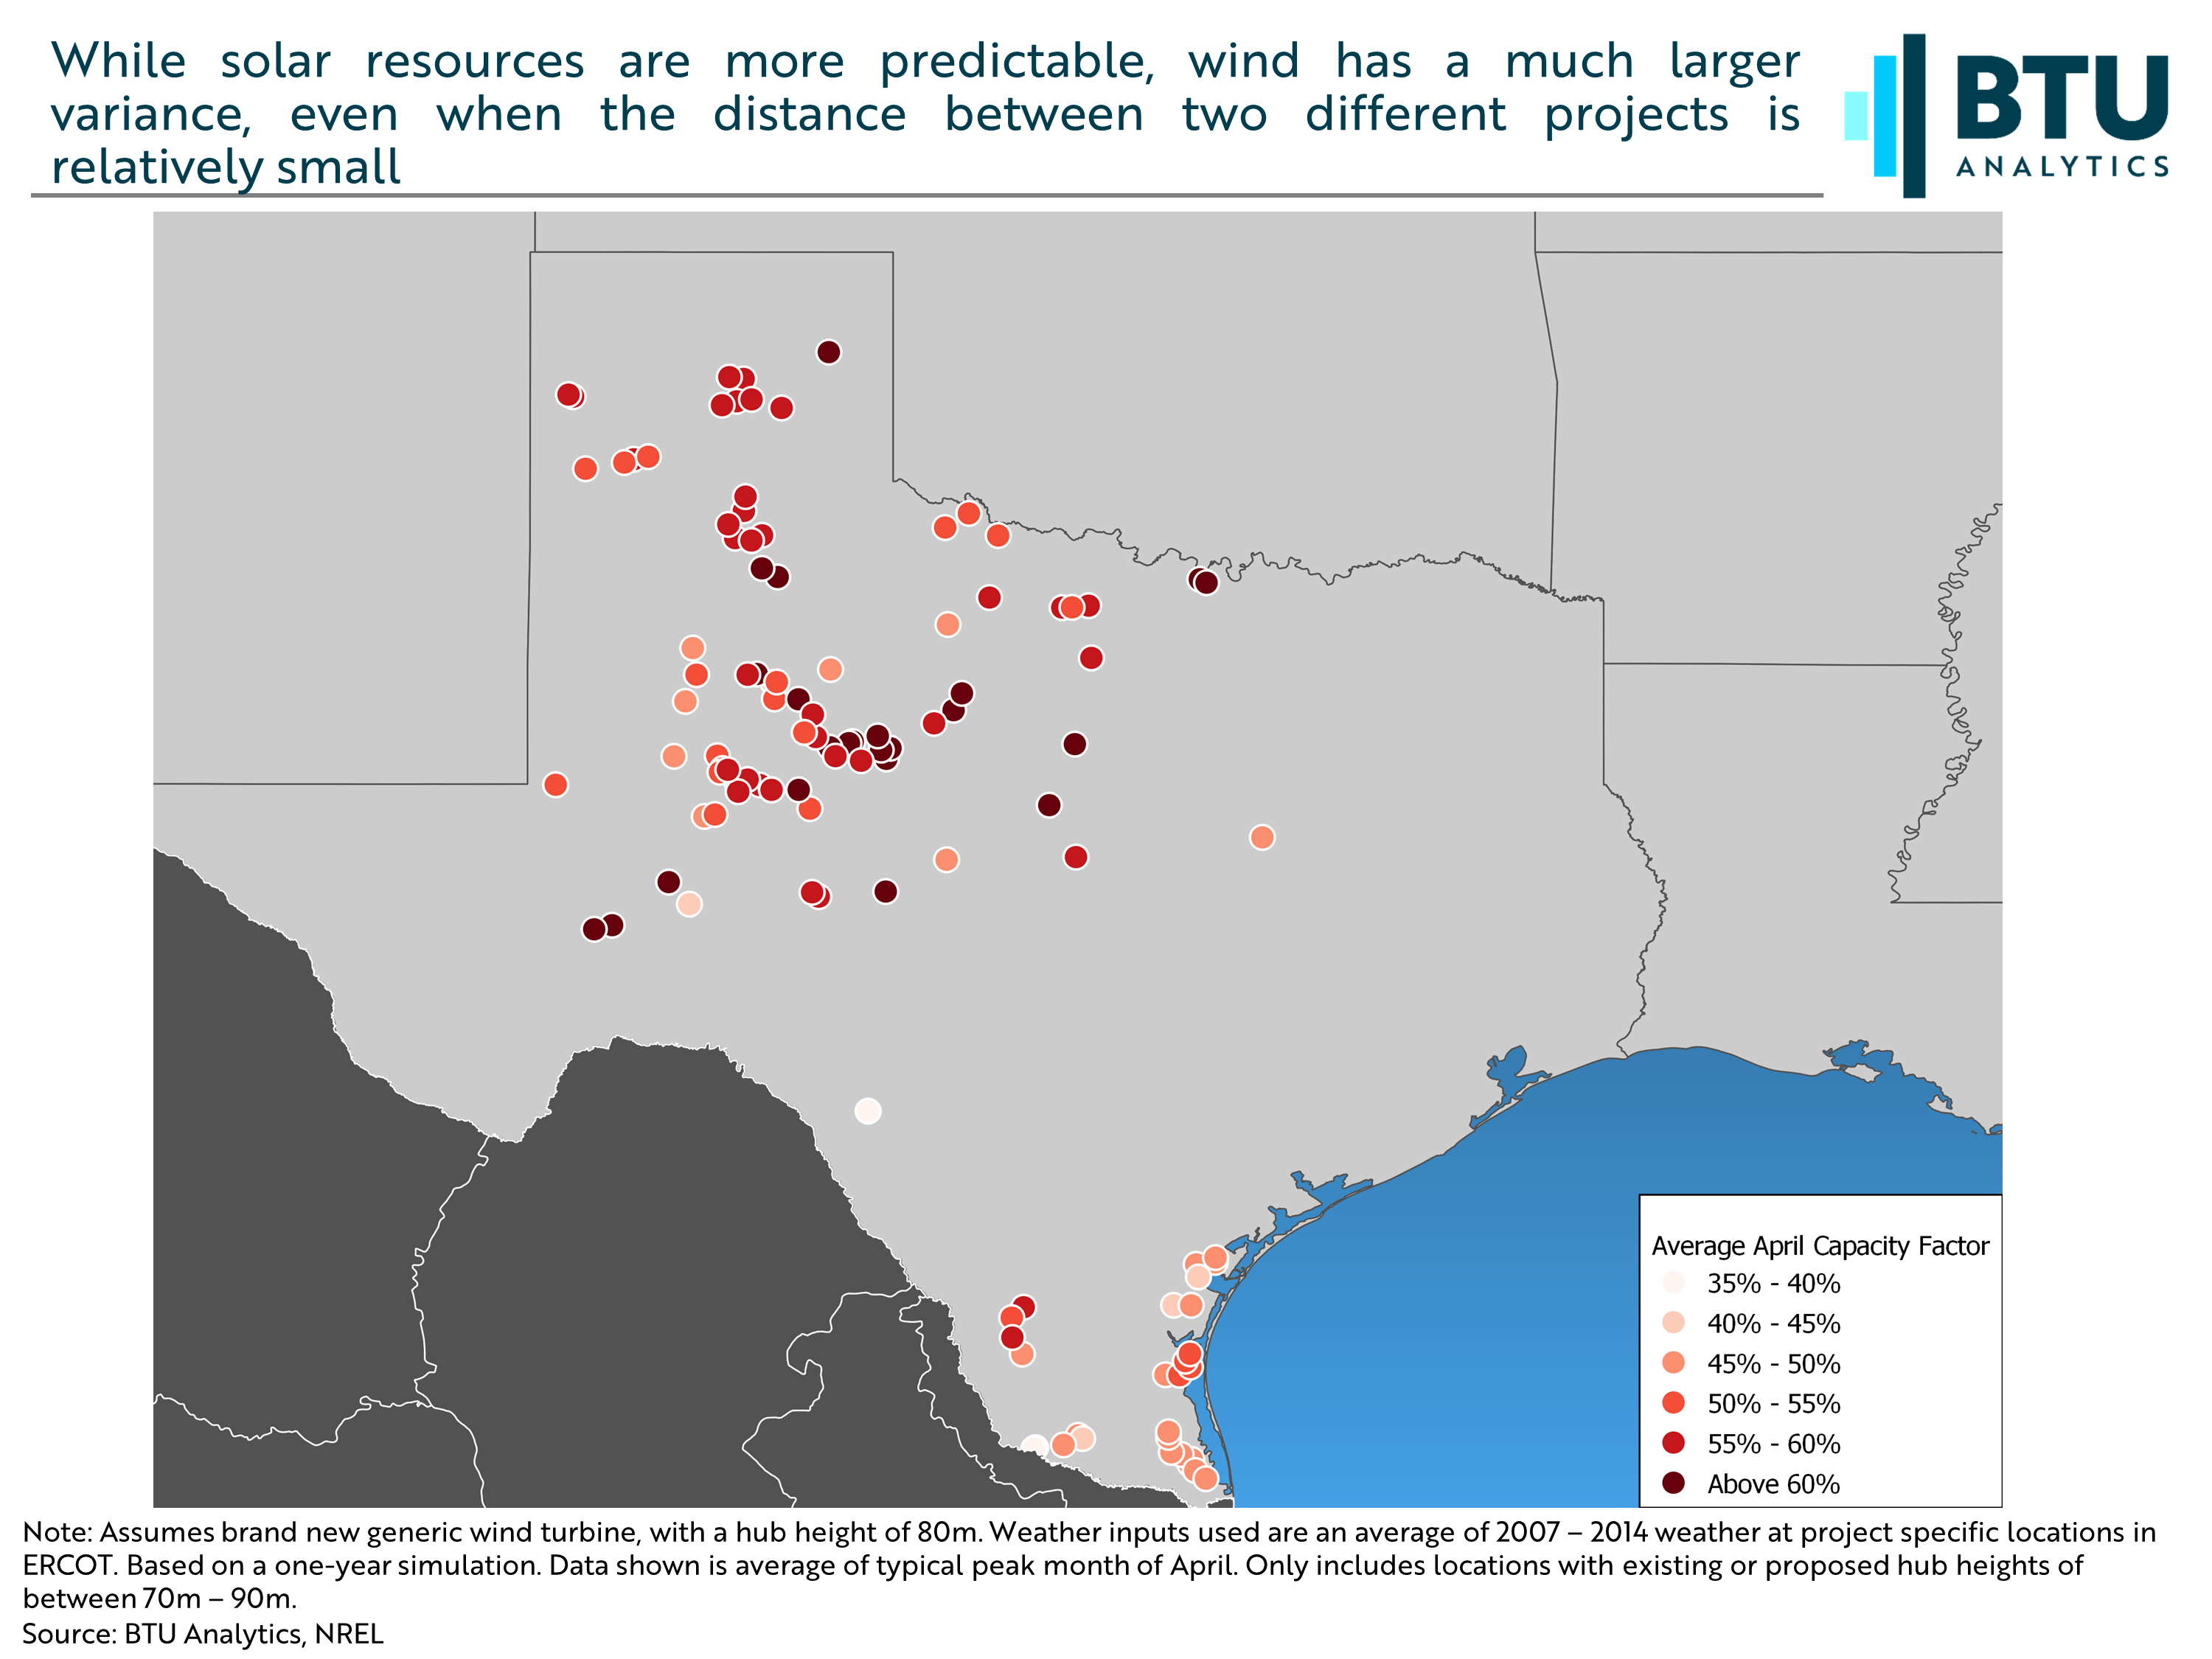
For the month of April (typically the month with some of the largest capacity factor averages) average capacity factors could range from 40 to 60%, even within a similar zone. Intuitively, it makes sense that wind speeds would be far less predictable than solar, given the sun will always rise and set every day around a predictable time (though cloudy days do exist). However, windy days are not always a guarantee, and even then, wind speeds have to be between a range to be effective; too little and the turbines won’t spin, too fast and generators can shut down for safety concerns.
Of course, quality of resources is only one factor to consider when siting new projects. For other considerations and insight around other fuel types watch for upcoming Energy Market Insights.