As companies execute on emissions reduction targets, understanding how much carbon is emitted to generate a megawatt of power becomes an important factor, especially for those companies that can shift load regionally or are expanding their facilities. This is called carbon intensity and differs by state and region based on how individual generation mixes have changed. Today’s Energy Market Insight will look at those differences and the drivers for varying carbon intensity.
Let’s start with a macro view of how the Lower 48’s capacity and generation mix have changed over the past few years. The graphic below breaks out capacity and generation by fuel type. It is probably no surprise that coal capacity and generation have been on a consistent decline while natural gas and renewables have been consistently climbing.

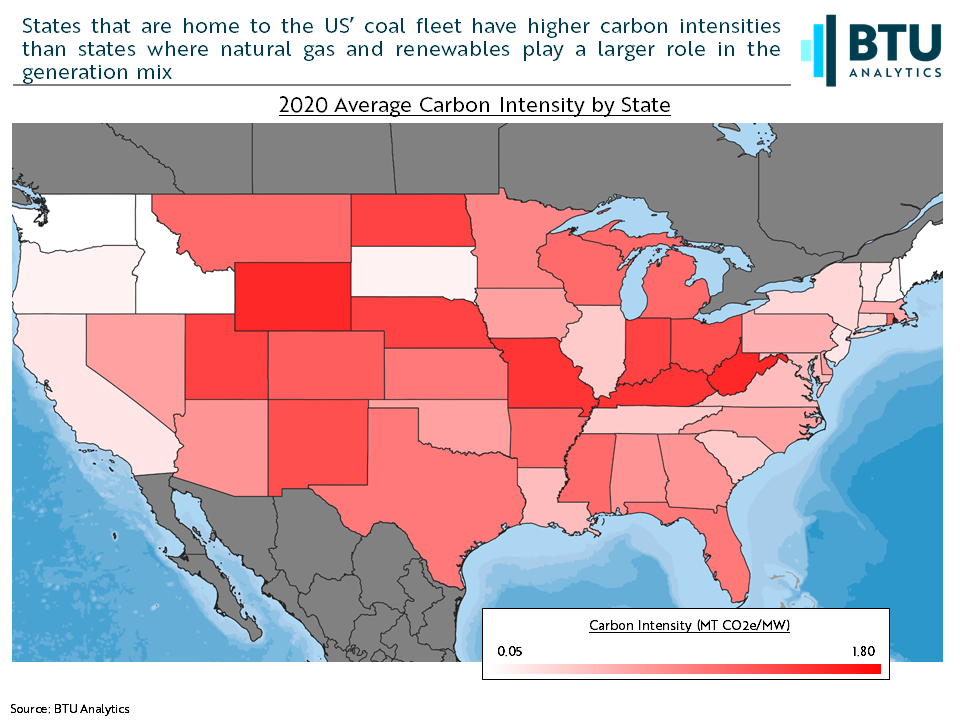
However, these trends have not been felt equally across the Lower 48. For example, in states with local coal supply, coal-fired power plants still provide a meaningful source of generation. Illinois, Indiana, Kentucky, Ohio, and West Virginia are home to more than 60 GW of operational coal plants; that’s about a quarter of the US’ fleet of coal-fired plants.
While that generation has been on the decline, those plants provide a significant source of emissions and increase the average carbon intensity for every megawatt generated. This can be seen in the map below which shows the average metric tons of carbon dioxide equivalent emitted per megawatt.
Since most states do not act independently when it comes to balancing the electric grid, we should aggregate this data up to the ISO level to see how carbon intensity has trended over the last five years. The graphic below shows the seven US ISOs as well as regulated utilities grouped into the Southeast and West regions accordingly.
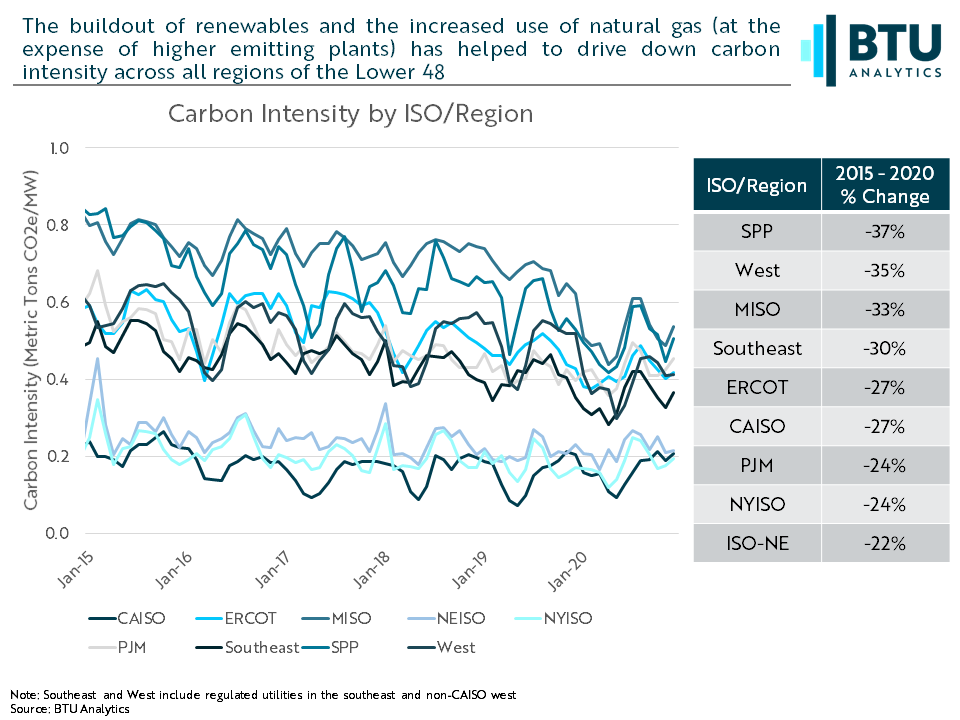
Across the board, all regions of the US have seen declining carbon intensity. There are a few broad themes driving these declines. First, as we saw above, coal-fired power has been increasingly pushed out of the stack. This has mostly been driven by weakening natural gas prices over the past 10 years, making gas-fired generation more economic. This trend can be seen in ISO New England where gas-fired generation has been more competitive, while renewable generation, while growing, is still a very small portion of the overall mix.
On the other side of the spectrum is SPP. Historically, SPP relied on coal generation. The proliferation of wind capacity and generation in SPP over the last 10 years has helped drive down overall carbon intensity in the ISO. Carbon intensity in SPP has fallen 37% in the last five years.
To understand how the US’ power supply stack will change as renewable generation continues to get built out, see BTU Analytics’ Power View platform. The Power View provides a vetted view for each proposed project in the US and quantifies the risk that lays ahead for each project to help make sense of generation queues that can be opaque and misleading.