BTU Analytics is excited to introduce our newest report: the US Power Brief. This monthly report is designed to provide a snapshot of US wholesale power markets, including high-level details on supply and demand fundamentals, pricing, and project development. So, this Energy Market Insight will look back at some recent energy-related headlines and show how the report can be used to keep you well-informed in the ever-changing energy markets.
If you would like a free copy of this month’s report or would like to learn more about our other power offerings, analysis, and data, please fill out this contact form and include “US Power Brief” in the text box at the bottom of the page.
This past May, hotter than normal temperatures helped contribute to ERCOT setting an all-time peak load record of 71.6 GW, which was 8.8 GW more than their previous May peak. Combining this factor with the continued rise of natural gas prices following Russia’s invasion of Ukraine resulted in significantly higher and more volatile prices during the month of May for ERCOT, as seen in the snapshot below from the US Power Brief.
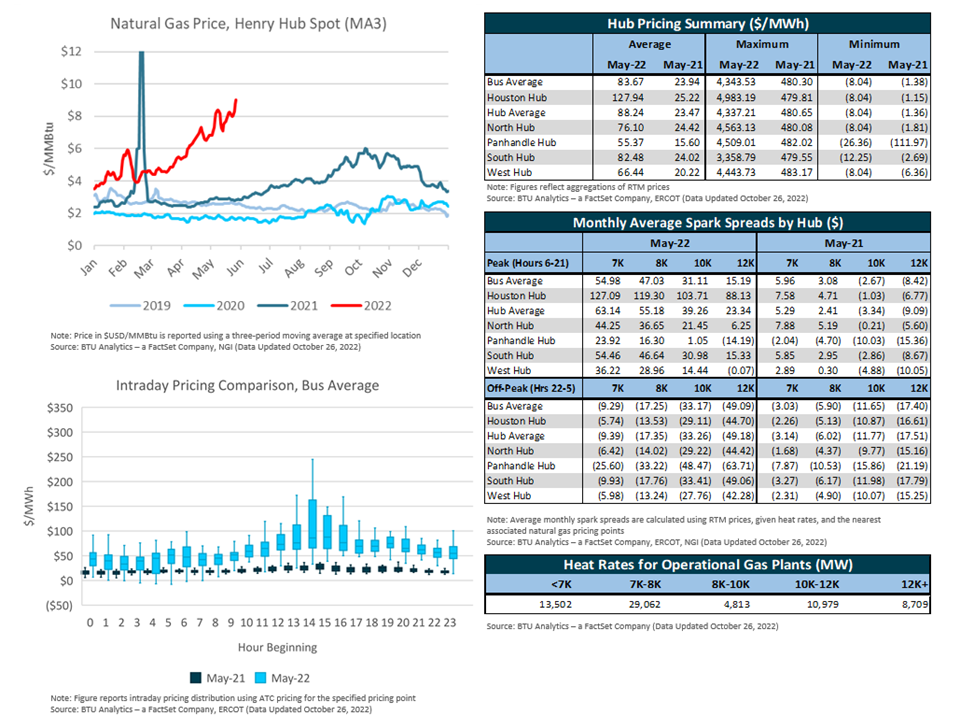
As seen in the graphic above, natural gas prices at Henry Hub traded between $7 and $9 dollars for most of May. Record load combined with these high natural gas prices resulted in a bus average power price of $83.67/MWh, which is $60 higher year-over-year. While this led to most gas plants being economic during peak hours in May 2022, the spark spread for an efficient gas plant with a heat rate of 7 MMBtu/MWh would still have been negative during off-peak hours. This is primarily due to both high natural gas prices and the increased wind generation during off-peak hours in ERCOT driving down average power prices.
Another headline this summer announced the retirement of the 811 MW Palisades nuclear facility in MISO. This retirement, as well as 4.1 GW of coal retirements since June 1st, 2021, played a part in MISO failing to procure enough capacity to meet their estimated peak load. We can use the US Power Brief to see how the generation mix changed following these retirements.
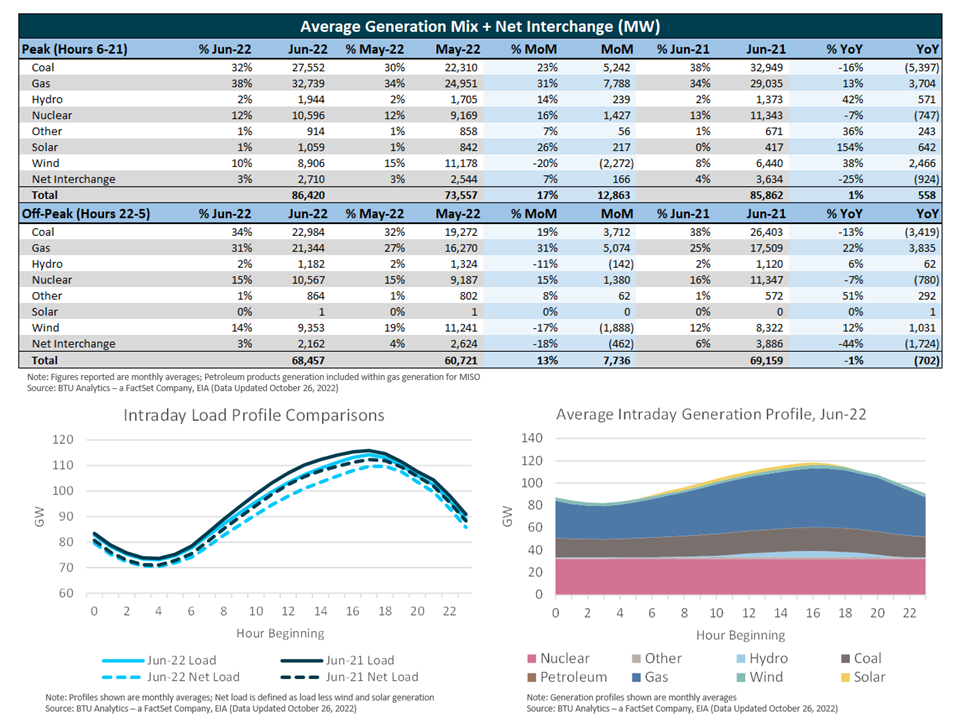
We can see that, despite the retirement of Palisades, nuclear generation increased on average from May 2022 to June 2022. However, this is due to nuclear plants Callaway and Waterford 3, which have a combined capacity of 2.4 GW, being offline for most of the month of May. Using June’s generation mix instead shows that year-over-year nuclear and coal generation decreased by 747 MW and 5.4 GW, respectively. So, as the Power Brief shows, despite the headlines about the Palisades shutdown, the real mover was falling coal generation. Also visible is the fact that natural gas and wind were the main replacements for this lost generation, with wind increasing by 2.5 GW and natural gas increasing by 7.4 GW year-over-year. Wind’s overall impact can be seen in the Intraday Load Profile Comparisons chart, and although peak hour load stayed constant year-over-year, June 2022 net load during peak hours decreased by about 3 GW compared to June 2021 net load.
Amid an intense and sustained heat wave across the Western US, CAISO made headlines by setting record load during the first week of September. A record load of 51.1 GW was set at 5 PM on September 6th, 2022, causing CAISO to utilize demand response measures. The US Power Brief provides insight into how the ISO was able to meet demand during the event and what peak load has been in the past.
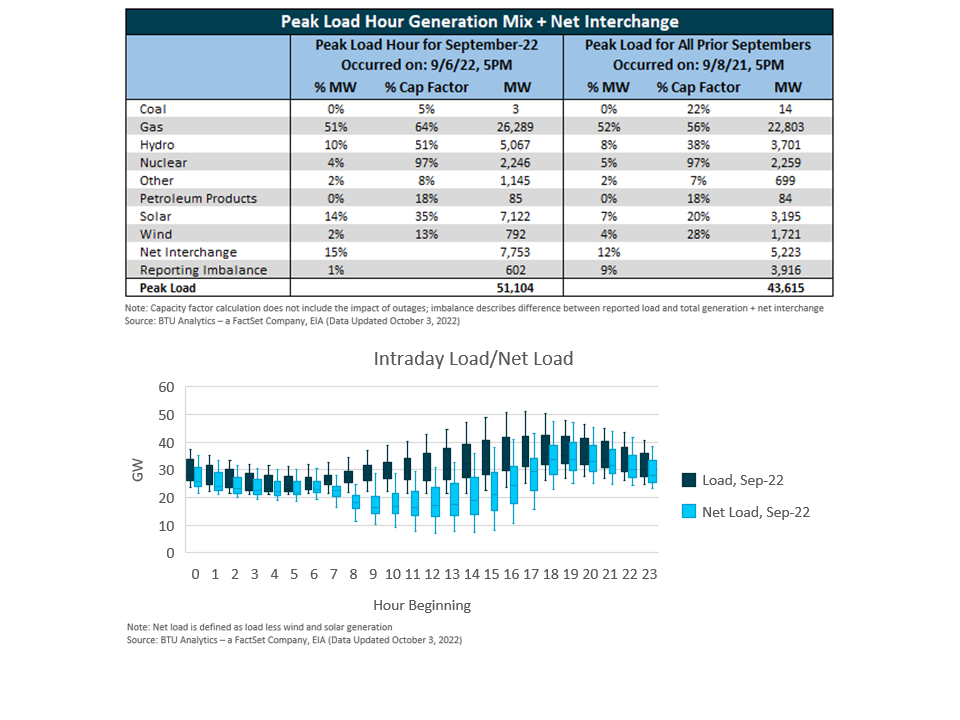
We can see that the previous peak load event for the month of September was 7.5 GW lower than the peak hit during 2022. CAISO was able to match demand by having nearly 4.0 GW more of solar generation this year compared to last year’s peak load event, with natural gas, hydro, and interchange helping to make up the rest of the difference. Especially relevant in California, with its ample sunshine generation during the midday hours, we can use the Intraday Load/Net Load chart to see the differences between the timing of peak net load and peak load in general across CAISO. The “whiskers” of the plot above show the maximum and minimum of load throughout the month, with the “box” comprising of the middle 50% of values. This shows that, although load peaks between 4 PM and 6 PM, net load, which represents the load met by thermal generation resources like gas, typically peaks somewhere between 6 PM and 8 PM due to the lack of solar generation during this time.
We hope that you’ve enjoyed this quick preview of the US Power Brief. The report is available to current BTU Analytics Power View subscribers; however, if you would like to receive a free copy of this month’s report, fill out the form here and include “US Power Brief” in the text box at the bottom of the page.