The stay-at-home orders, that more than 80% of Americans are currently under, are trying to dampen the spread of the coronavirus, however, these necessary actions run the risk of dampening electricity demand and in turn natural gas-fired generation. What have we seen so far and what does this tell us about what we can expect in the power markets as this crisis drags on?
Today I’ll be looking at just one slice of BTU’s outlook as the US and the world endure the impacts of the COVID-19 pandemic and the OPEC+ price war. To keep our clients apprised of our latest market outlooks, BTU has been hosting one-on-one discussions. If you are a client of BTU and have not participated in our State of the Market webinar, email info@BTUAnalytics.com to schedule one. If you are not a client of BTU but would like to hear BTU’s views you can also sign-up for a one-on-one discussion here.
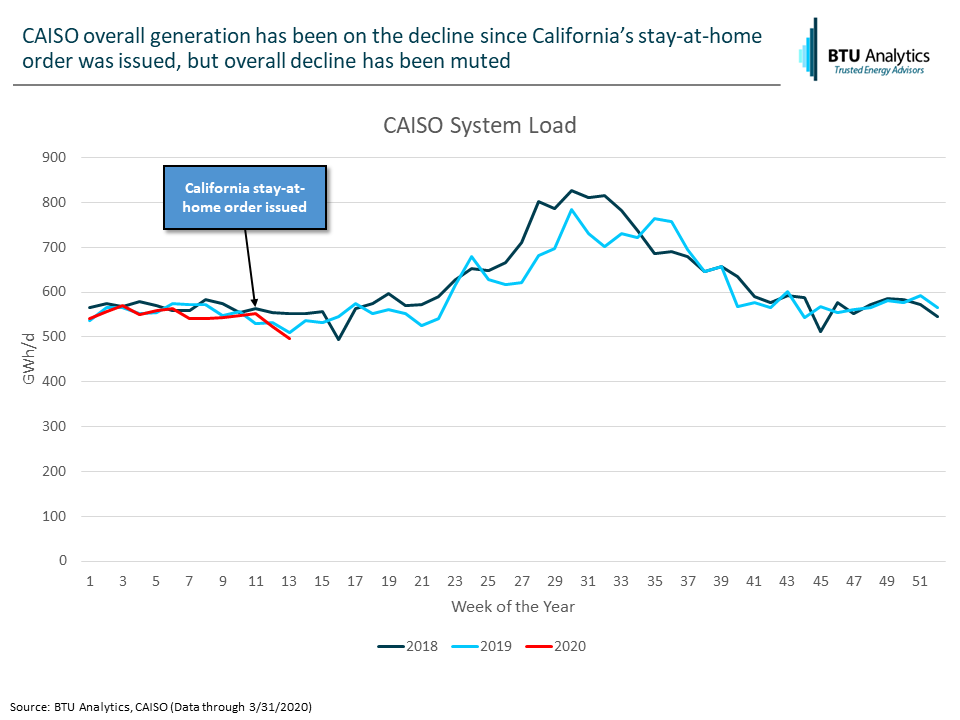
Now back to the power markets. For the ISOs in total (representing about 60% of total US generation) declines have been more or less in-line with seasonal load declines going into the spring shoulder season. However, the state-by-state patchwork approach of stay-at-home orders can mask the effects lower load, so let’s first focus on California who was the first state to issue an order on March 16th.
The graphic below shows total CAISO (which covers about 80% of California) load. In the two weeks since California issued their stay-at-home order, system load has declined, but not far off from where load was sitting this same time last year.
While no drastic declines can be seen looking at total load, let’s look at how individual fuels are reacting. For this let’s zoom into PJM where similar to CAISO, slight inklings of load declines (above and beyond seasonal load declines) are starting to be seen.
The next graphic compares daily generation by fuel to average generation in the first week of March for that respective fuel. So negative values mean that fuel had lower generation for that day than the first week of March and positive values mean that that fuel generated more on the specific day than it did in the first week of March. Remember, even without the coronavirus we would expect overall load to decline over the course of March as we enter Spring, but we want to see if any individual fuel is being hit harder.
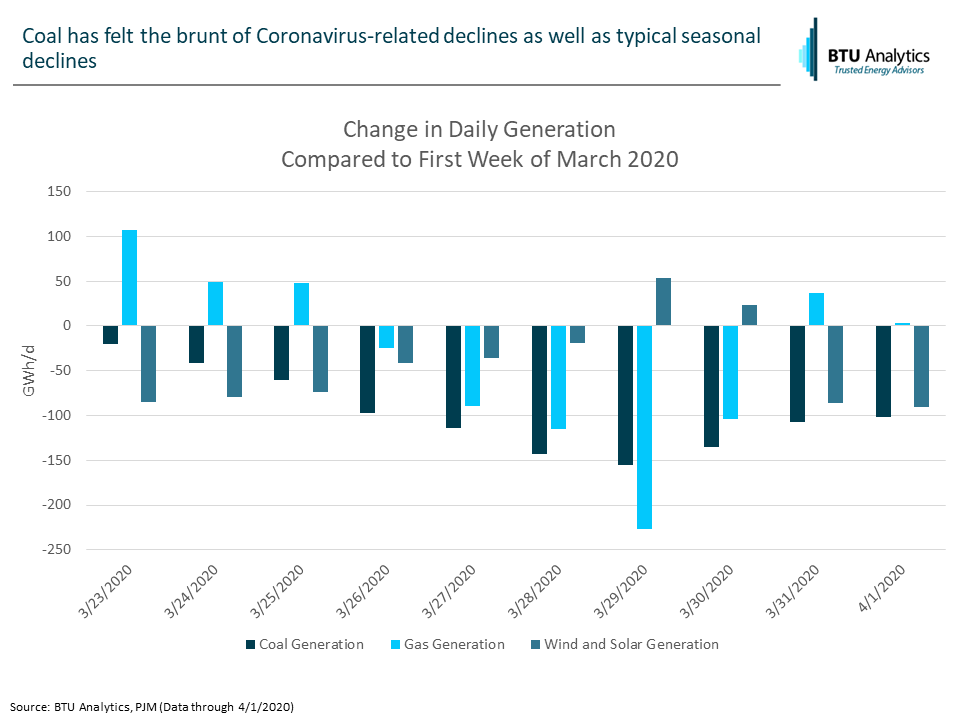
We can see in the graphic that compared to the beginning of the month, coal has been consistently generating less, contributing the most consistently to declines in overall generation. However, this graphic also shows another dynamic at play.
Has gas generation also declined? Yes, for the most part. Has volatility in gas-fired generation been driven by coronavirus related declines? Not entirely. The next graphic, which shows the same data but for just gas generation and wind and solar generation highlight what I mean.
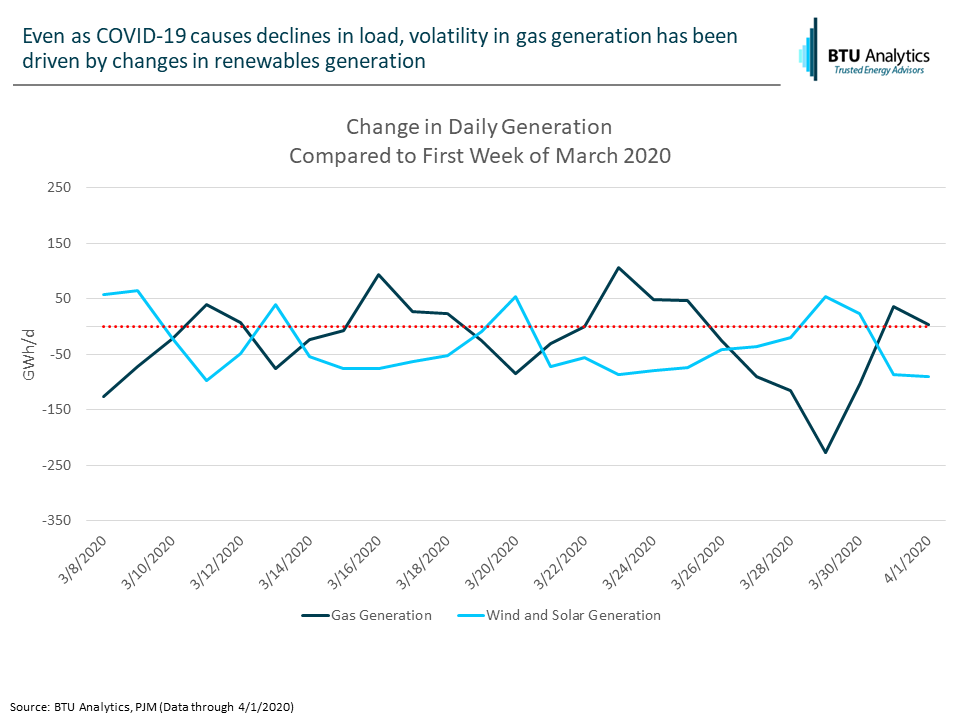
While gas generation will certainly also feel the declines in coronavirus related load loss, it is currently being driven more by volatility in renewables generation as shown by the inverse relationship between the two in the graphic above. Even as this crisis drags on, and well after it is gone, expect this larger battle between gas and renewables generation to show through in power markets.