The power sector makes up more than a quarter of US emissions, with overall emissions on the decline due to falling coal generation in favor of natural gas, wind, and solar generation. However, emissions from natural gas plants have been on the rise due to the buildout of natural gas-fired generation over the previous decade. Rising emissions, coupled with federal, state, and corporate mandates to cut them, put natural gas pipelines squarely in the middle of the decarbonization push. Previously we discussed the opportunities for natural gas pipelines to reduce end-use emissions through green hydrogen. Today’s Energy Market Insight will focus on natural gas power plant CO2 emissions within various natural gas pipeline footprints.
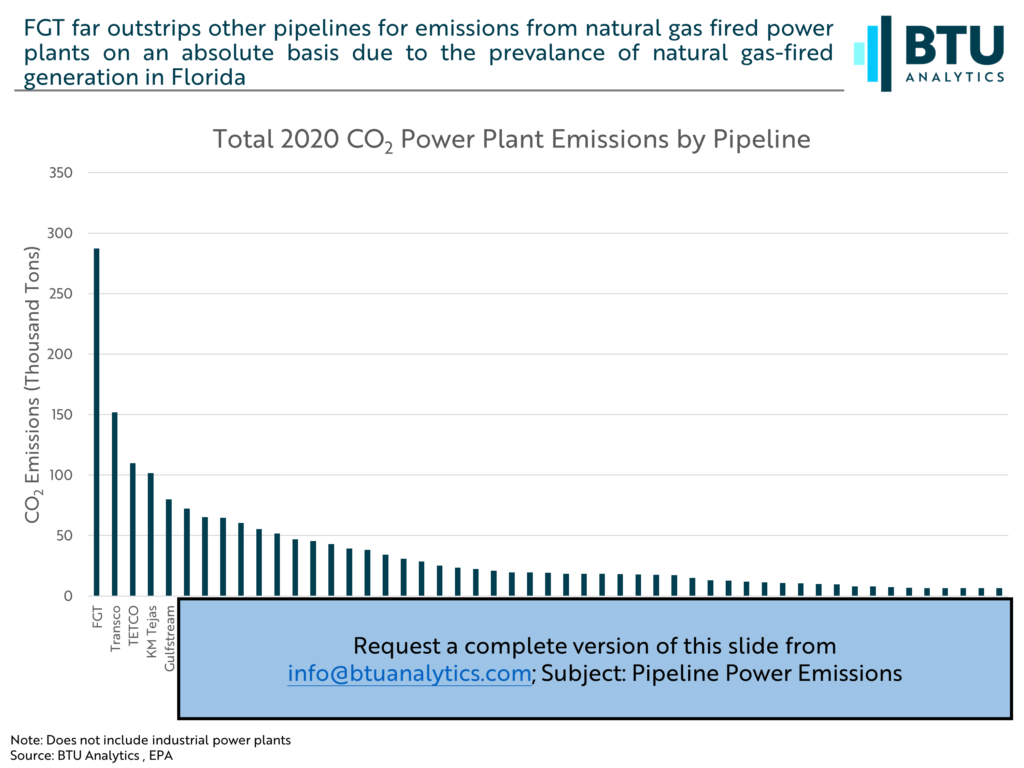
The chart below highlights natural gas-fired powered emissions for the top 50 natural gas pipelines serving power plants across the US. Given the reliance on natural gas power in Florida, Florida Gas Transmission (FGT) takes the top spot on the list in 2020. FGT links natural gas supply to nearly 41 GW of power plants in Florida and the Gulf Coast. Transco and TETCO, two of the longest and oldest pipelines in the US, serve the second and third largest share of US natural gas power plants in the US. Both pipelines have benefited from over 20 GW of new natural gas fired generation developed in Appalachia over the last ten years due to supply growth in the Marcellus and Utica.
However, for FGT, given the prevalence of natural gas generation in Florida, absolute emissions is perhaps not the correct metric to use to compare various natural gas pipeline footprints. Instead, the graphic below compares emissions per MW generated. This provides a better view of the relative emissions on different pipes and which pipes are supplying plants with higher emissions.
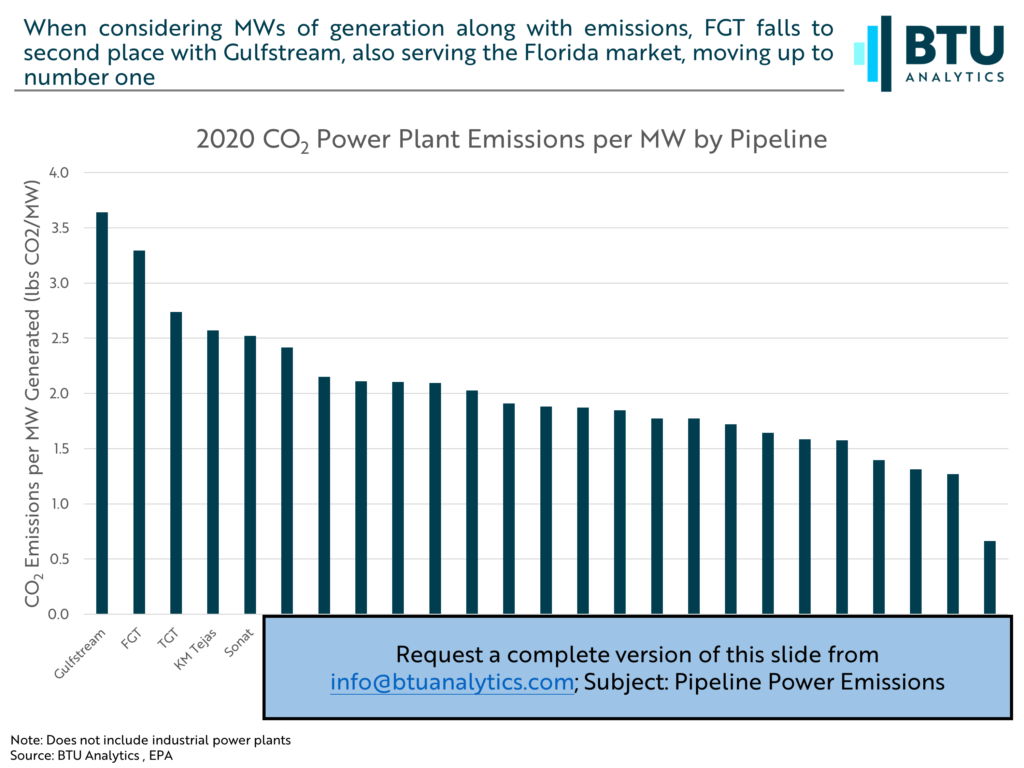
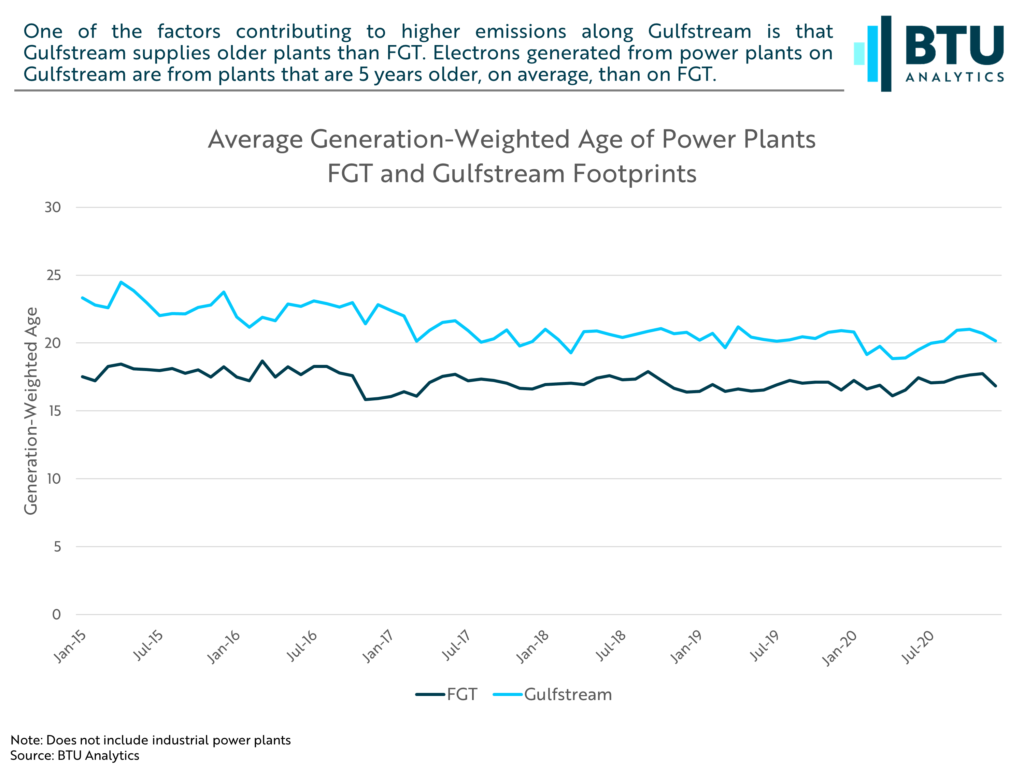
Adjusting for generation, FGT drops, but not by much. Fellow Florida-market pipeline Gulfstream takes the top spot for supplying the highest-emitting natural gas power plants. There are multiple reasons why plants on Gulfstream would emit more than FGT including the turbine technology and vintage, as well as emissions control equipment that is installed at the plant. Age of the plant can provide a good proxy for these factors. In fact, plants on Gulfstream are about 5 years older than plants on FGT on a generation-weighted basis.
As more and more market participants, states, and municipalities are looking to reduce their carbon footprints and make strides towards emissions goals, understanding sources of emissions will become critical. Utilize BTU Analytics’ expertise and data to better understand the risks and opportunities across the hydrocarbon and power industries.