After a long protracted regulatory battle, Duke and Dominion pulled out of the Atlantic Coast Pipeline (ACP) in early July. BTU published a Bulletin the next day with our take on how that cancellation would affect the natural gas market. While the loss of ACP’s connectivity will have impacts on gas flow dynamics throughout Appalachia and the Atlantic Seaboard, today we’ll look at Dominion and Duke’s power markets in Virginia and North Carolina to see what solar, wind, and gas power plant buildout we are likely to see over the next few years.
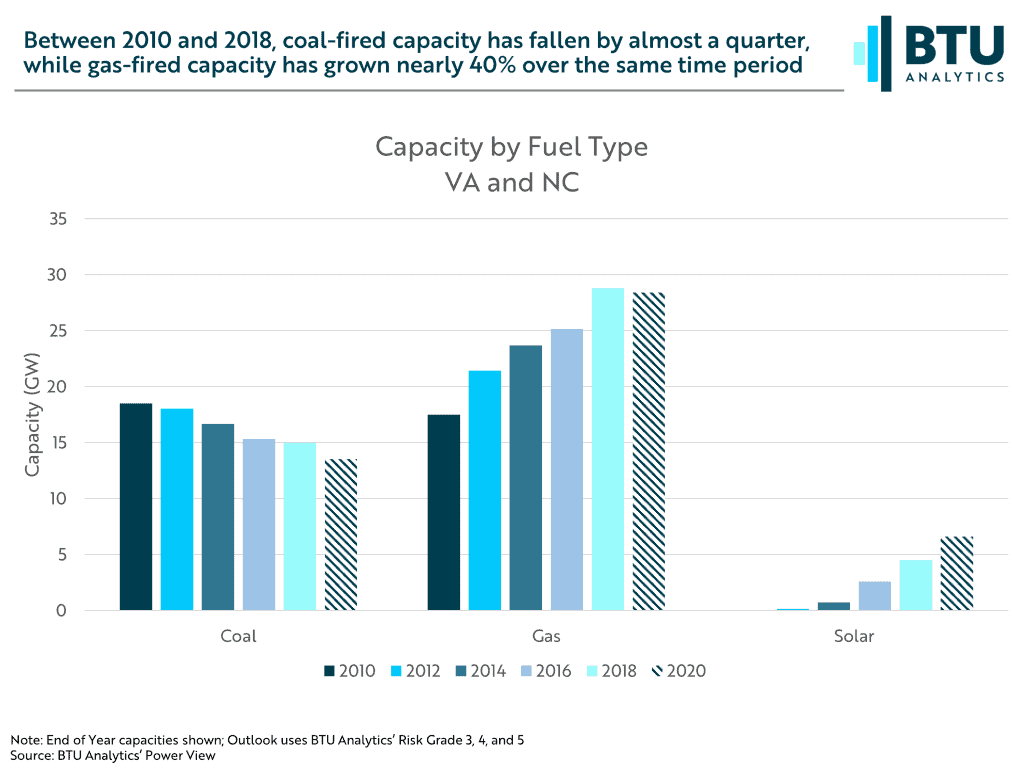
Like other regions around the country over the past ten years, as cheap gas from the Marcellus and Utica became more widely available, coal generation and capacity in Virginia and North Carolina were put under pressure. This can be seen in the graphic below where between 2010 and 2018 coal capacity fell by 23%, while gas capacity increased by nearly 40% over the same time. Solar capacity has also increased substantially during this time period, but we’ll return to that in a moment.
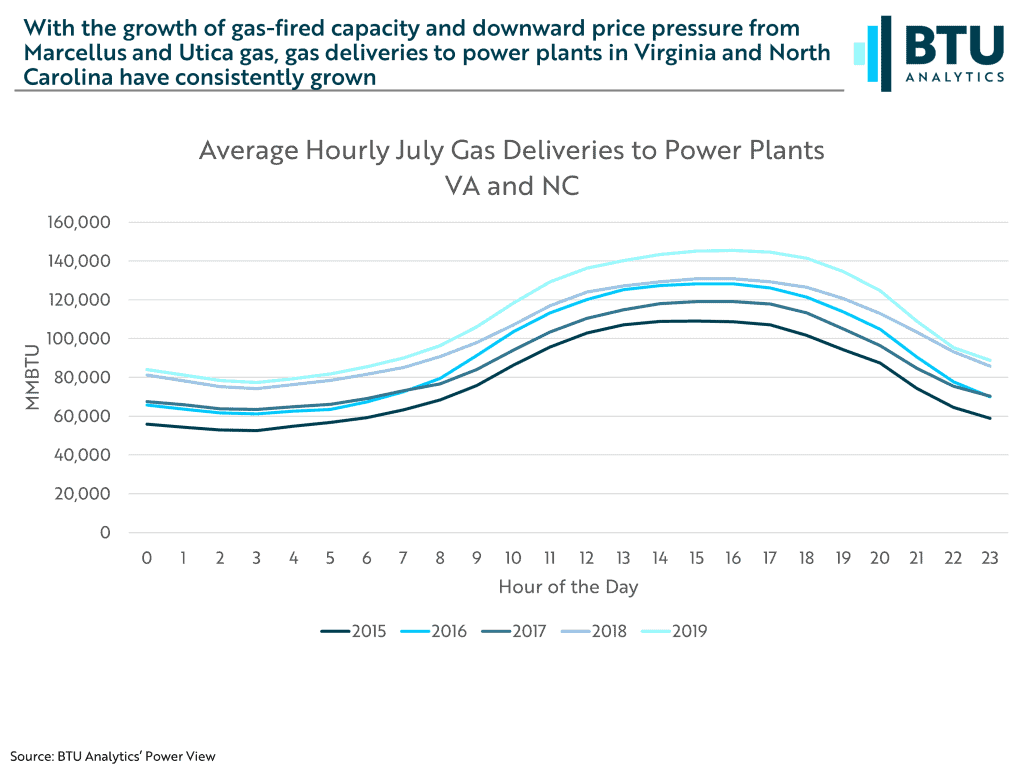
With decreasing gas prices and increased gas plant capacity, came increasing gas consumption. Below we pulled hourly power plant delivery data from BTU’s Power View for all plants within VA and NC. Typically, gas burn peaks in July in the Atlantic Seaboard, so the graphic below shows average hourly gas burn in July. Between 2015 and 2019 peak gas burn, occurring in the afternoon hours in July, has increased by 33%.
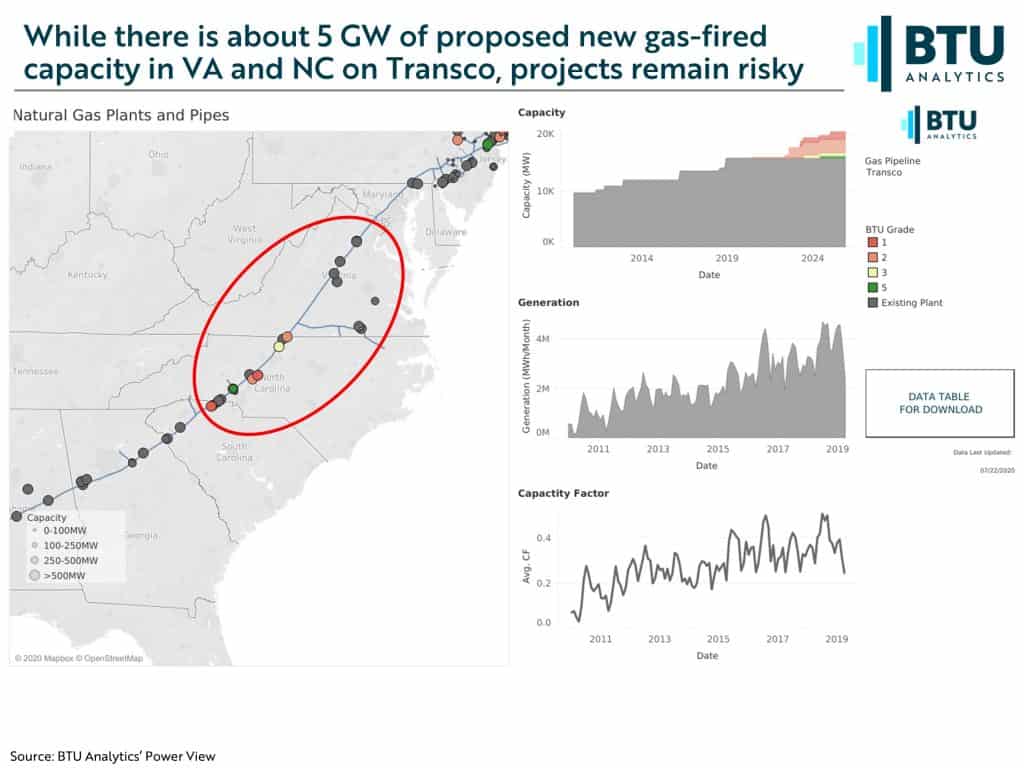
While gas capacity growth at the expense of coal capacity has been the recent trend, the forward view on gas buildout shows a slowdown. Transco is the main thoroughfare through VA and NC and with a new feature of the Power View we can see gas capacity buildout by pipeline. The graphic below shows gas buildout on Transco in VA and NC. While there are a handful of plants proposed, BTU grades most of that capacity as very risky as indicated by the BTU Grade (for more details on how BTU Grades proposed capacity). Recent roadblocks for the C4GT plant in Prince William, VA illustrate this risk.
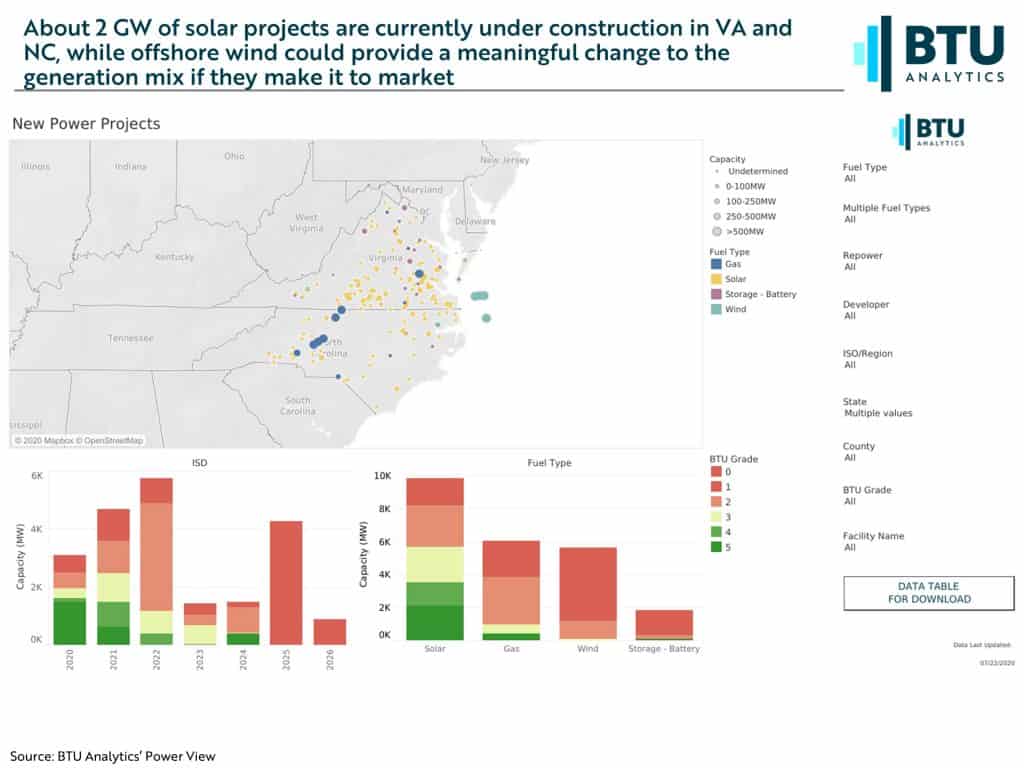
As shown in the first graphic above, while growth is slowing (in fact, slightly reversing given some planned retirements), renewables buildout in the form of solar continues to accelerate. The graphic below shows BTU’s new capacity outlook across fuel types in VA and NC. Notice the corresponding BTU Grades, with reds being the riskiest moving to the greens, which are the least risky. The pace of solar buildout is expected to continue to outstrip gas, while offshore wind (Kittyhawk and Coastal Virginia Offshore Wind) could be a game changer to the generation mix given the much higher capacity factors of offshore wind compared to solar.
Interested in seeing how other markets will respond to a myriad of renewable project proposals? Or what gas power plant buildout is likely across other pipeline footprints? Request your free trial of the BTU Power View HERE