Natural gas-fired generation has received the bulk of the benefit from retiring coal generation. With coal retirements showing no signs of stopping, that pattern will likely continue. However, challenges abound for gas-fired generation. As wind and solar generation continues to grow, it will take a toll on gas. How large a toll? Today we’ll look at the impacts already being experienced.
As a case study, this commentary will look at Clark County, Nevada. Home to Las Vegas, 7 GW of gas-fired capacity, and just over 1.5 GW of solar. Beyond just the boundaries of Clark County itself, the county, through NV Energy, participates in the Western Energy Imbalance Market, so generation development across the Southwest also has an impact on the county.
Like many areas in the Southwest, Clark County has seen significant growth in solar capacity buildout. The snapshot below from BTU’s Power View platform shows current operational plants in Clark county.
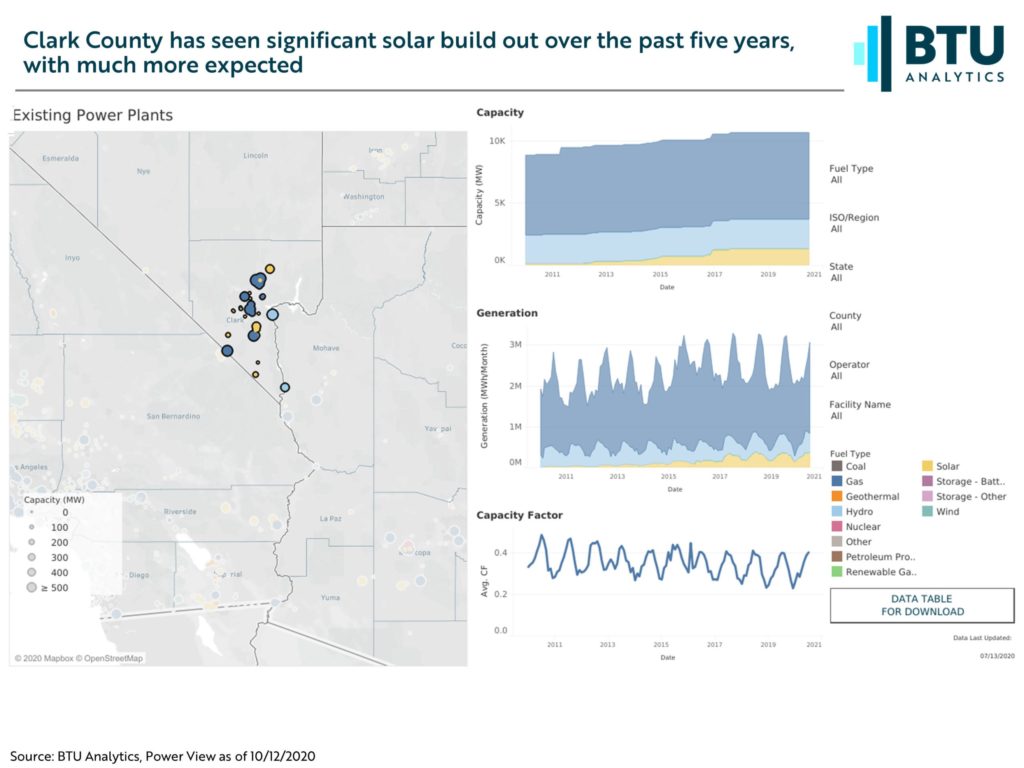
Over the past four years, solar development within the county has doubled, although has plateaued since about 2018. BTU doesn’t expect that plateau to last though; currently, we estimate about 3 GW of solar capacity that is likely to come to market in Clark County over the next three years.
With load relatively flat in the West, the addition of new generation becomes a zero-sum game. New solar generation will have to be offset by other forms of generation. Let’s see what that has looked like in Clark County. Below is another snapshot from a different feature of the Power View. Here you can see and download historic hourly generation and heat inputs at a unit level.
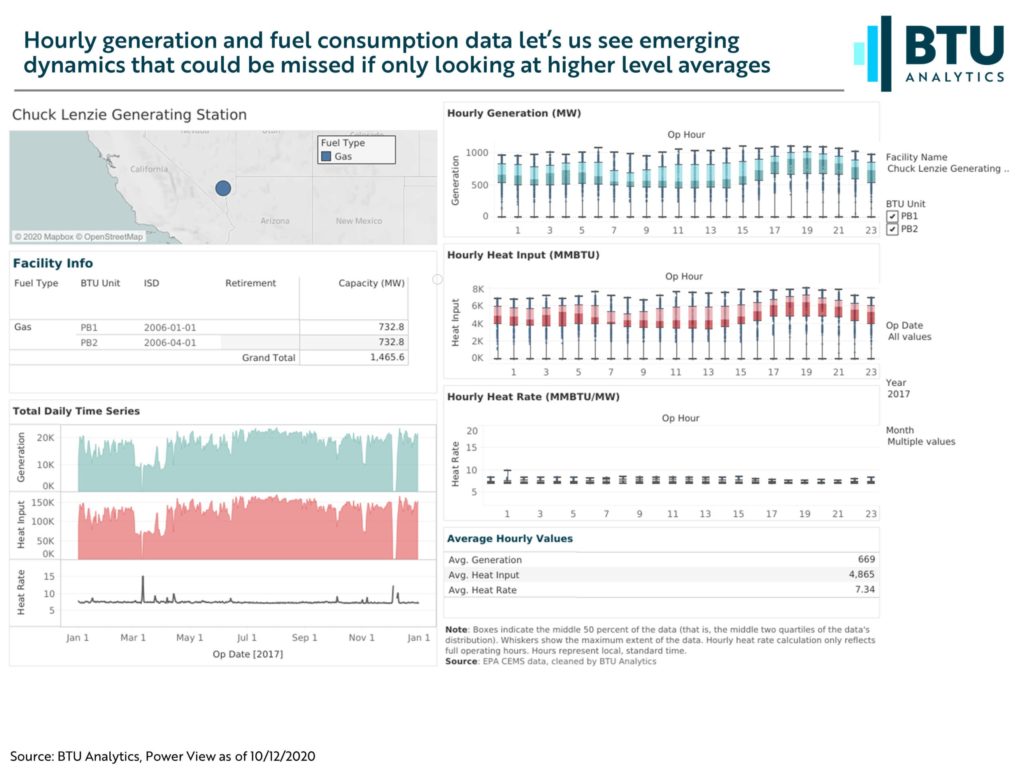
In the above snapshot, the Chuck Lenzie Generating Station (CLGS) operational data is shown for 2017. CLGS is a 1.5 GW, a combined-cycle natural gas plant that has been in operation since 2006 and is located just north of Las Vegas. As compared to 2017 above, the charts below show some interesting dynamics at play more recently.
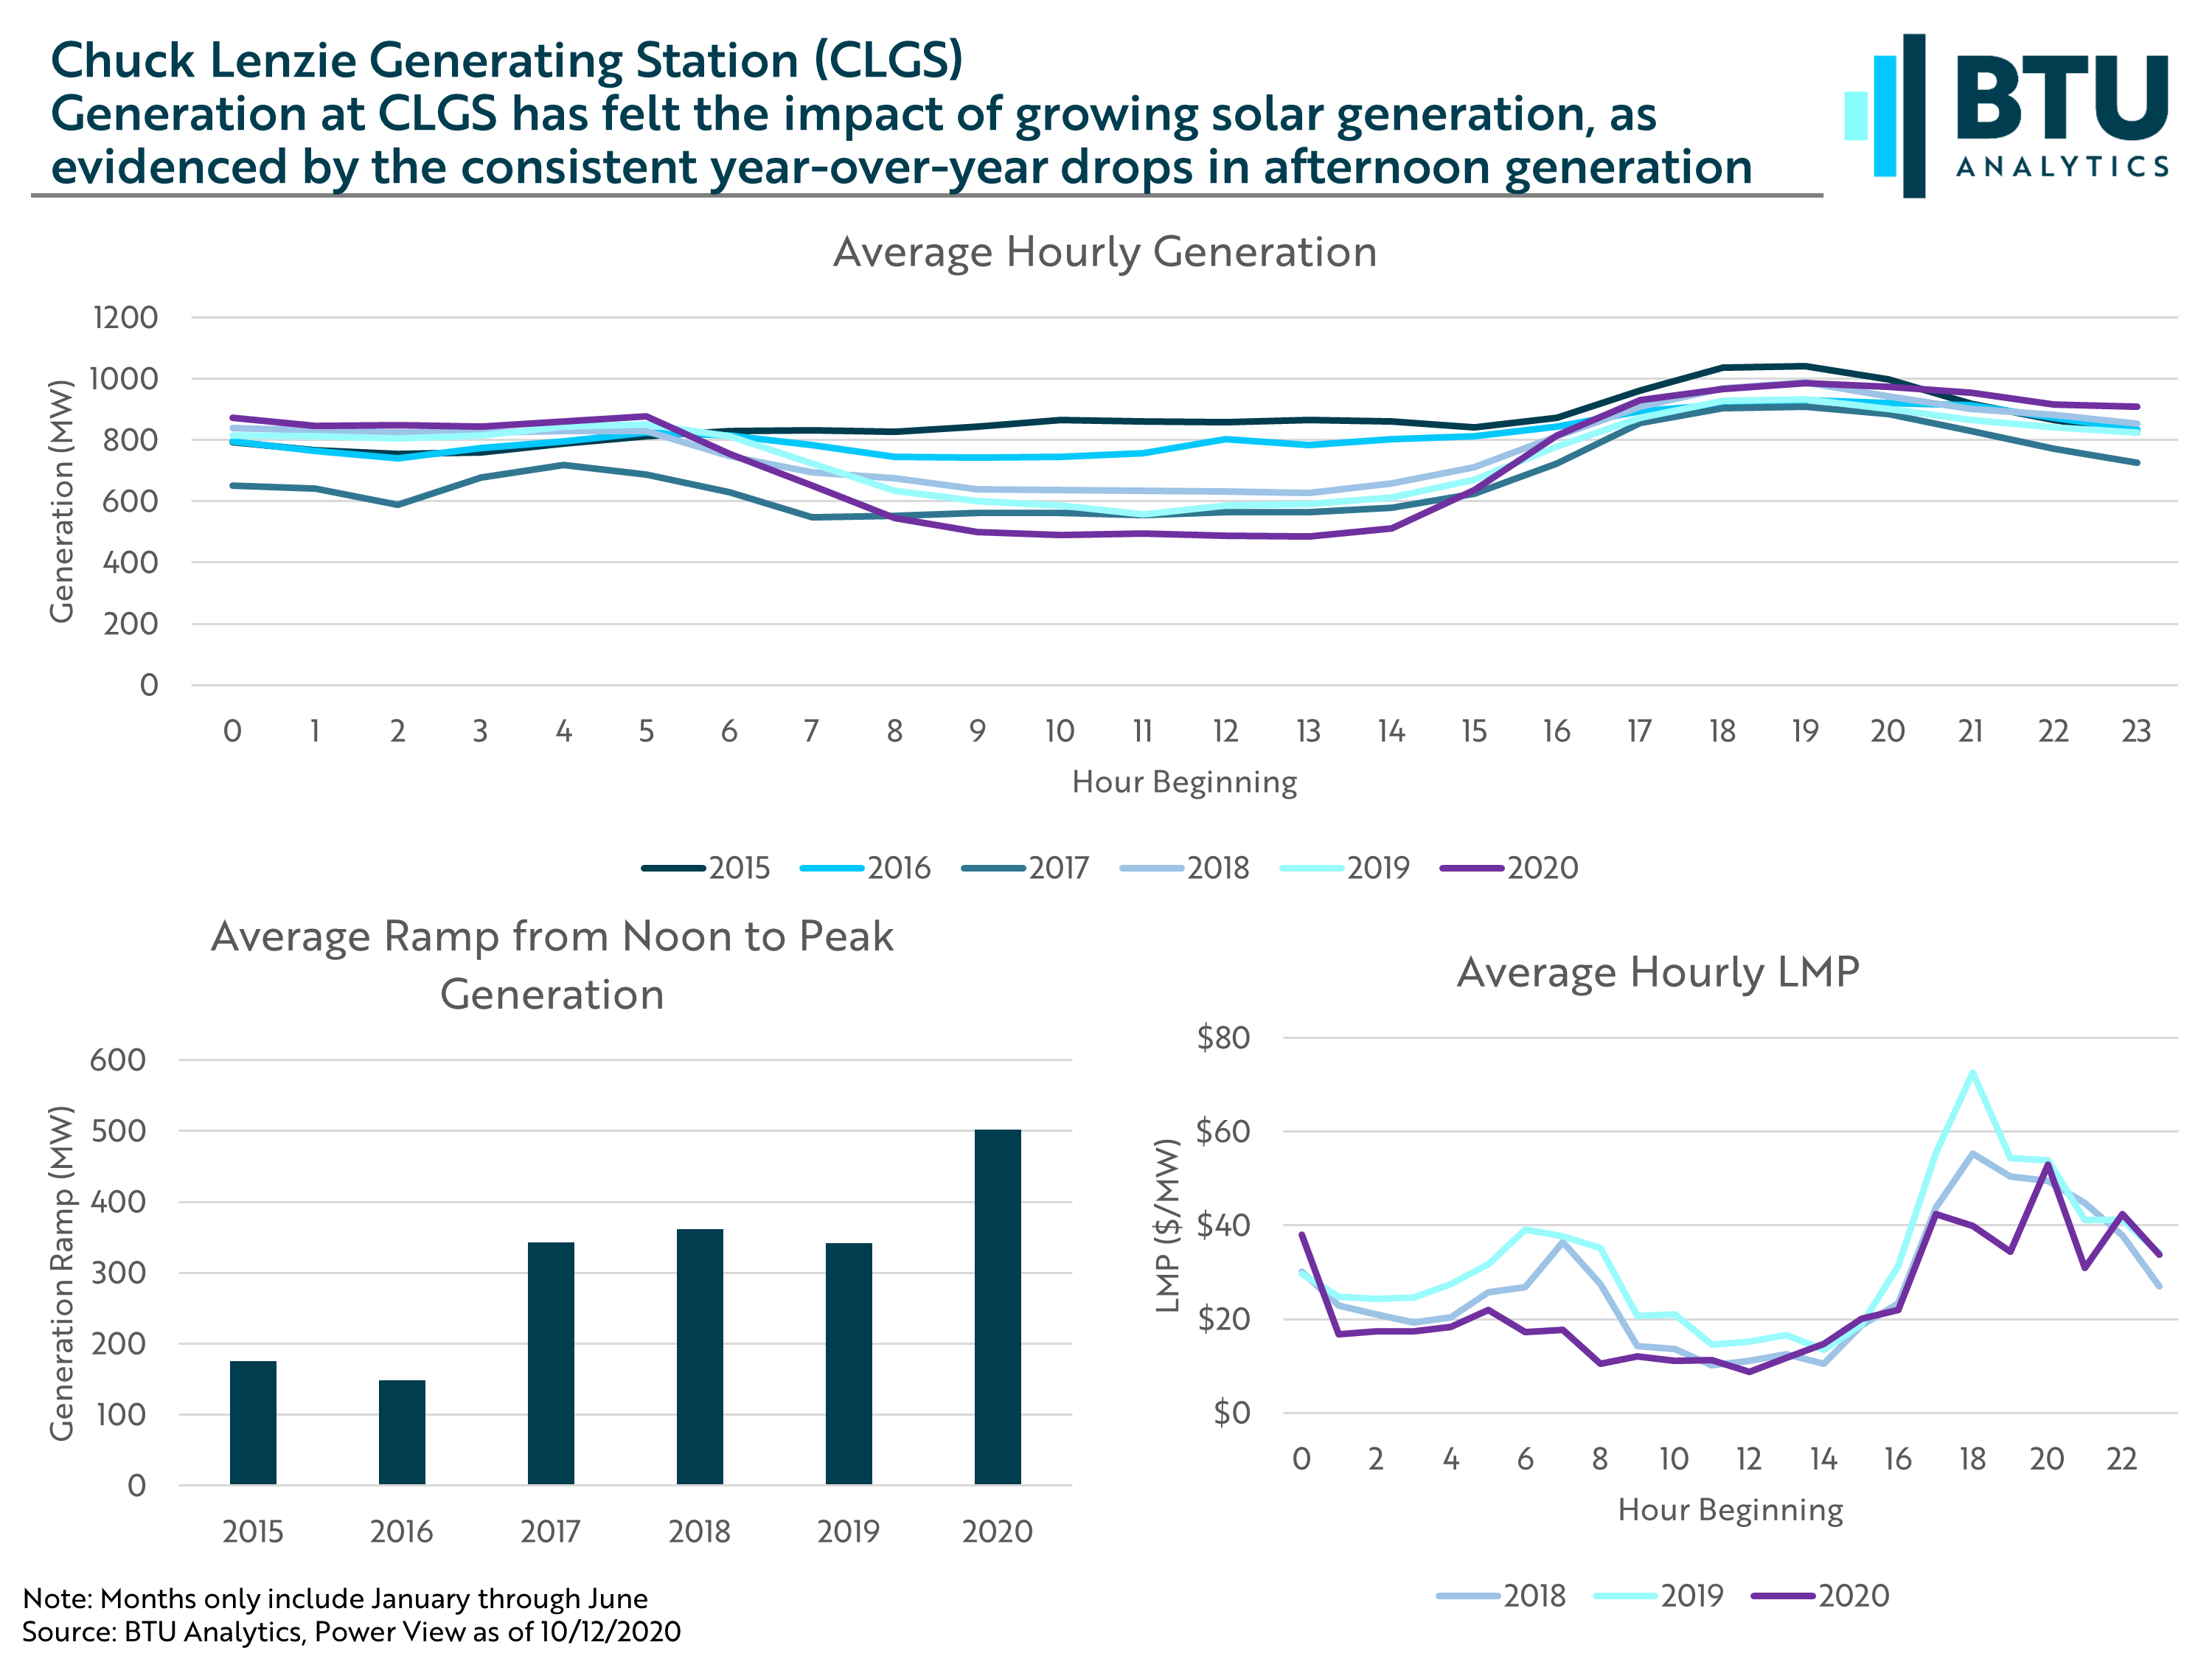
The top graphic shows the average hourly generation at CLGS where we can see generation evolved into what is known as the duck curve. This is the phenomenon we see in areas where solar generation has become increasingly prevalent. As solar generation ramps up through the day, other forms of generation must ramp down. Here CLGS displays a pretty consistent tick down in afternoon generation year after year. Interestingly, however, average daily gas deliveries off of the Kern River pipeline to CLGS have been flat from 2019 to 2020.
The bottom right graph shows the associated locational marginal pricing (LMP) averaged hourly at CLGS from 2018 through 2020. On average over the last three years, the highest on-peak pricing has been in the early morning and evening when solar is not available.
The graph at the bottom left is another illustration of the duck curve. This graph shows the average ramp needed from noon to peak load at 7 PM. As solar generation has grown year after year, that ramp at CLGS has increased from about 150 MW to nearly 500 MW. Natural gas plants will continue to see demand for the afternoon ramp increase as solar generation proliferates across the US. How gas plants are currently compensated by ISOs for the afternoon ramp is a topic for another commentary. Total L48 power generation capacity across all fuels is at 1,145 GW. L48 installed solar capacity at 36.2 GW currently and is forecast by BTU to grow by 70.4 GW in the next three years based on projects in advanced development. The natural gas-solar dynamic will no longer be relegated to the Southwest and natural gas generation will increasingly feel the impact. To follow these dynamics in detail, request a demo of BTU Analytics’ Power View platform.