Renewables curtailments continue to grow as the buildout of wind and solar capacity outstrips the buildout of transmission infrastructure. With insufficient transmission structure, circuits become congested and lead to the curtailment of renewables generation. In previous Insights, BTU Analytics has discussed the evolution of curtailments in ERCOT (both in 2021 and in 2022). Today, however, we will turn toward SPP and CAISO and see how curtailments there have changed.
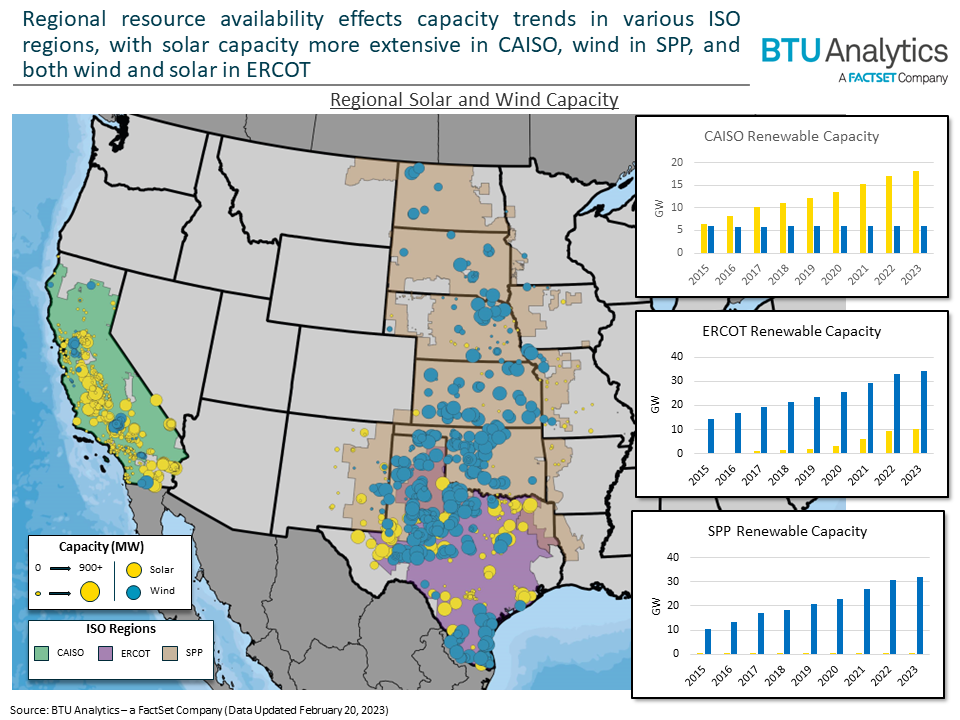
The map below displays the respective operational capacity for wind and solar in SPP, ERCOT, and CAISO. Due to the regional resource quality differences of wind and solar, California and the Southwest have seen the strongest solar buildout, with CAISO growing solar capacity by 50% (6 GW) over the past five years, and the Midcontinent experiencing a similar growth rate (11 GW) in its wind capacity. Interestingly, ERCOT has grown both its wind and solar capacity aggressively, which makes it an interesting comparison for both CAISO’s solar and SPP’s wind.
For CAISO, where solar generation is much more prevalent than wind, curtailments have accelerated. Of course, with solar generation growing, the overall magnitude of solar curtailments would be expected to grow as well. While that has certainly been the case, the percentage of total generation that is curtailed is also growing, indicating the problem is growing worse. For example, CAISO reached a new record in May of 2022, curtailing 566 GWh (about 15%) of a total of 3,800 GWh of solar generation for the month.
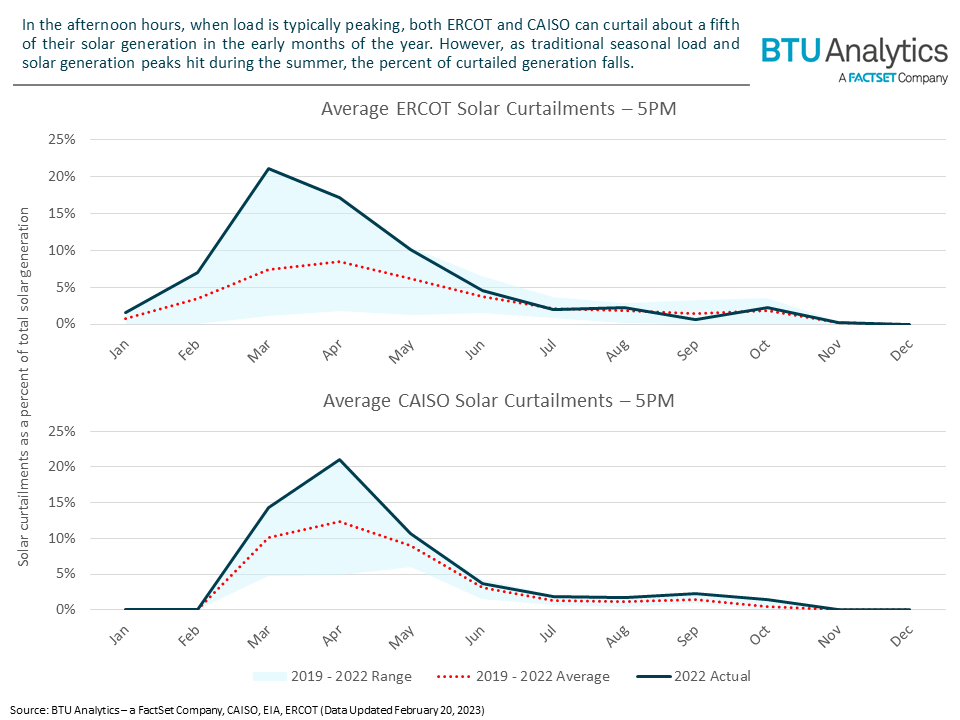
Taking an hourly view can show us how curtailments could impact intra-day demand peaks. The graphic below compares average solar curtailments in CAISO and ERCOT at 5 PM. While spring typically does not see extreme load (2022 did not obey this rule), both ISOs have grown their curtailments early in the year. Both ISOs also curtailed about a fifth of their solar generation in March and April.
SPP and its wind generation tell a similar story of growing curtailed generation. This year was a banner year for SPP when it comes to both wind generation and curtailments. The ISO curtailed an average of 10% of its total wind generation in 2022, up from 7% in 2021 and 3% in 2020. April is typically where we see peak wind generation, so instead of looking at data through the year, like we did for ERCOT and CAISO above, let’s look at the data through an average day in April. As the graphic shows below, SPP saw almost double the proportion of its wind generation curtailed compared to ERCOT (6% in ERCOT versus 11% in SPP). Not only that, but SPP’s aggressive growth in curtailments in 2022 is on display as well, illustrated by how much larger 2022’s actual numbers are compared to the four-year average.

All this data presented above makes a strong case for a more aggressive buildout of transmission infrastructure in the U.S., however that will be slow going without congressional transmission reform and has the potential to become more costly given security issues raised by recent high-profile attacks on the U.S.’ electrical infrastructure. Until then, energy storage developers and operators, recently encouraged by the IRA, are likely to reap the rewards of pricing arbitrage caused by curtailments and transmission congestion. BTU Analytics will continue to cover these developments in future Energy Market Insights and in our power market offerings, such as the US Power Brief.